Ichimoku Screener [Pineify]Advanced Multi-Timeframe Ichimoku Screener - Complete Market Analysis Tool
This sophisticated Ichimoku Screener represents a comprehensive approach to multi-timeframe market analysis, combining four distinct Ichimoku-based indicators into a unified screening system. Unlike traditional single-symbol indicators, this screener provides simultaneous analysis across multiple assets and timeframes, enabling traders to identify optimal trading opportunities with enhanced precision and efficiency.
Key Features
Multi-asset screening capability for up to 10 symbols simultaneously
Four customizable timeframes per symbol for comprehensive analysis
Four integrated Ichimoku-based indicators working in harmony
Real-time visual feedback with color-coded signals
Customizable Ichimoku parameters for personalized analysis
Clean, organized table display for easy interpretation
Automated signal strength assessment and timing
How It Works
The screener employs the traditional Ichimoku Kinko Hyo methodology, utilizing five core components: Conversion Line (Tenkan-sen), Base Line (Kijun-sen), Leading Span A (Senkou Span A), Leading Span B (Senkou Span B), and displacement calculations. Each component is mathematically calculated using specific period lengths:
Conversion Line = (Highest High + Lowest Low) / 2 over conversion period
Base Line = (Highest High + Lowest Low) / 2 over base period
Leading Span A = (Conversion Line + Base Line) / 2
Leading Span B = (Highest High + Lowest Low) / 2 over lagging span period
The screener processes these calculations across multiple securities simultaneously using TradingView's security() function, enabling real-time cross-asset analysis. The system tracks state changes using barssince() functions to provide precise timing information for each signal type.
Trading Ideas and Insights
This screener excels in identifying momentum convergence patterns where multiple Ichimoku components align across different timeframes. The most powerful signals occur when:
Cloud color aligns with price position relative to the cloud
Conversion Line crosses above/below Base Line in the same direction as cloud bias
Multiple timeframes show consistent directional bias
Entry signals appear with minimal bars since formation (indicating fresh momentum)
For trend following strategies , focus on symbols where the cloud maintains consistent color across higher timeframes while showing recent entry signals on lower timeframes. For reversal opportunities , identify assets where cloud color changes coincide with price re-entering the cloud after extended periods above or below.
The screener particularly excels in cryptocurrency and forex markets where momentum shifts can be dramatic and sustained. By monitoring multiple timeframes simultaneously, traders can identify when short-term signals align with longer-term trends, significantly improving trade success probability.
How Multiple Indicators Work Together
The four integrated indicators create a comprehensive analytical framework through synergistic interaction:
Ichimoku Cloud (IchiCld) establishes the primary trend bias by comparing Leading Span A with Leading Span B. When Span A > Span B, the cloud displays bullish characteristics; when Span A < Span B, bearish characteristics emerge. The indicator tracks duration since the last cloud color change, providing momentum persistence insight.
Ichimoku Lagging Cloud (IchiLagCld) determines price position relative to the displaced cloud formation. This indicator identifies whether current price action occurs above, below, or within the cloud structure, revealing support/resistance dynamics and trend confirmation signals.
Conversion vs Base (IchiC>Base) monitors the relationship between short-term (Conversion Line) and medium-term (Base Line) momentum. Crossovers in this relationship often precede significant price movements and provide early trend change warnings.
Ichimoku Entry (IchiEnt) synthesizes all components into actionable signals by requiring alignment between cloud bias, price position, and conversion/base relationship. This multi-factor confirmation approach significantly reduces false signals while maintaining sensitivity to genuine momentum shifts.
The mathematical foundation ensures that each indicator contributes unique information while maintaining logical consistency. The system's strength lies in requiring multiple confirmations before generating entry signals, following Ichimoku's original philosophy of comprehensive market analysis.
Unique Aspects
This implementation distinguishes itself through several innovative features:
Advanced State Tracking : Unlike standard Ichimoku indicators that show current values, this screener tracks duration since state changes , providing crucial timing information for signal freshness and momentum strength assessment.
Multi-Asset Efficiency : The screener eliminates the need to manually check multiple charts by presenting comparative analysis across assets and timeframes in a single view, dramatically improving analytical efficiency.
Customizable Visual Feedback : The color-coding system adapts to different signal types and strengths, with recent signals receiving enhanced visual prominence to draw attention to fresh opportunities.
Professional Table Architecture : The organized display accommodates up to 40 symbol-timeframe combinations (10 symbols × 4 timeframes), with intelligent pagination for optimal screen utilization.
Signal Correlation Analysis : By displaying multiple timeframes for each symbol, traders can quickly identify timeframe confluence and divergence patterns that would otherwise require extensive manual analysis.
How to Use
Symbol Configuration : Enter up to 10 symbols in the Symbol input group. Use full exchange:ticker format for optimal compatibility (e.g., "BINANCE:BTCUSDT").
Timeframe Selection : Configure four timeframes in ascending order for logical analysis progression. Recommended combinations include 1m/5m/15m/1h for intraday analysis or 1h/4h/1D/1W for swing trading.
Ichimoku Parameters : Adjust the four core parameters based on your trading style:
Conversion Line Length (default: 9) - Controls short-term momentum sensitivity
Base Line Length (default: 26) - Determines medium-term trend identification
Leading Span B Length (default: 52) - Sets long-term trend calculation period
Displacement (default: 26) - Controls forward projection of cloud structure
Signal Interpretation :
Green backgrounds indicate bullish conditions
Red backgrounds indicate bearish conditions
Numerical values show bars since last state change
"L:" prefix indicates long entry signals
"S:" prefix indicates short entry signals
"N/A" indicates neutral/transitional states
Trading Workflow : Scan for symbols showing consistent signals across multiple timeframes, prioritize fresh signals (low bar counts), and use individual charts for precise entry timing and risk management.
Customization
The screener accommodates various trading approaches through parameter adjustment:
Scalping Configuration : Use shorter periods (Conversion: 5, Base: 13, Span B: 26) with 1m/3m/5m/15m timeframes for high-frequency opportunities.
Swing Trading Setup : Employ standard parameters with 4h/1D/3D/1W timeframes for position trading across days or weeks.
Cryptocurrency Optimization : Given crypto's 24/7 nature, consider using 4h/8h/1D/3D combinations for optimal signal timing.
Symbol selection can focus on correlated assets (e.g., major cryptocurrencies) for sector analysis or diverse assets for portfolio opportunity identification. The flexible timeframe configuration allows adaptation to any market's characteristic volatility and trading patterns.
Conclusion
This Advanced Multi-Timeframe Ichimoku Screener transforms traditional single-chart analysis into a comprehensive market monitoring system. By integrating multiple Ichimoku components across various timeframes and assets, it provides traders with unprecedented analytical efficiency and signal reliability.
The mathematical rigor of traditional Ichimoku analysis combines with modern Pine Script capabilities to deliver a professional-grade screening tool. Whether used for identifying trend continuation opportunities, spotting potential reversals, or conducting broad market analysis, this screener offers the analytical depth and practical functionality required for serious trading applications.
The system's emphasis on signal confluence across multiple timeframes and indicators significantly improves trade selection quality while reducing analysis time. For traders seeking to leverage Ichimoku's proven methodology across multiple markets simultaneously, this screener represents an essential analytical upgrade to traditional single-symbol approaches.
ابحث في النصوص البرمجية عن "swing trading"

Alt buy signal 1H Entry + 4H Confirm (MACD + Stoch RSI + HMA)This indicator is a multi-timeframe (MTF) analysis tool designed for the ALT trading , capturing entry signals on the 1-hour (1H) timeframe and confirming trends on the 4-hour (4H) timeframe. It combines MACD, Stoch RSI, and Hull Moving Average (HMA) to identify precise buy opportunities, particularly at reversal points after a downtrend or during trend shifts. It visually marks both past and current BUY signals for easy reference.
Key Features:
1H Entry Signal (Early Ping): Triggers on a MACD golden cross (below 0) combined with a Stoch RSI oversold cross (below 20), offering an initial buy opportunity.
4H Trend Confirmation (Entry Ready): Validates the trend with a 4H MACD histogram rising (in negative territory) or a golden cross, plus a Stoch RSI turn-up (above 30).
Past BUY Display: Labels past data points where these conditions were met as "1H BUY" or "FULL BUY," facilitating backtesting.
HMA Filter: Optional HMA(16) to confirm price breakouts, enhancing trend validation.
Purpose: Ideal for short-term scalping and swing trading. Supports a two-step strategy: initial partial entry on 1H signals, followed by additional entry on 4H confirmation.
Usage Instructions
Installation: Add the indicator to an IMX/USDT 1H chart on TradingView.
Signal Interpretation:
lime "1H BUY": 1H conditions met, consider initial entry (stop-loss: 3-5% below recent low).
green "FULL BUY": 1H+4H conditions met, confirm trend for additional entry (take-profit: 10% below recent swing high).
Customization: Adjust TF (1H/4H), MACD/Stoch RSI parameters, and HMA usage via the input settings.
Alert Setup: Enable alerts for "ENTRY READY" (1H+4H) or "EARLY PING" (1H only) conditions.
Advantages
Accuracy: Reduces false signals by combining MACD golden cross below 0 with Stoch RSI oversold conditions.
Dual Confirmation: 1H for quick timing and 4H for trend validation, improving risk management.
Visualization: Past BUY points enable easy backtesting and pattern recognition.
Flexibility: 4H confirmation mode adjustable (histogram rise or golden cross).
Limitations
Timeframe Dependency: Optimized for 1H charts; may not work on other timeframes.
Market Conditions: Potential whipsaws in sideways markets; additional filters (e.g., RSI > 50) recommended.
Manual Management: Stop-loss and take-profit require user discretion.

Candle Opens by HAZED🎯 Candle Opens by HAZED - Multi-Timeframe Open Levels Indicator
📊 Overview
This powerful indicator displays multiple timeframe opening prices on your chart, providing crucial reference levels that institutional traders and algorithms frequently monitor. Track up to 7 different timeframe opens simultaneously, from 1-hour to yearly, with advanced visualization features including dynamic coloring, heatmap analysis, and real-time status tracking.
✨ Key Features
📈 Multi-Timeframe Support:
- 1H, 4H, Daily, Weekly, Monthly, Quarterly, and Yearly opens
- Each timeframe can be individually enabled/disabled
- Automatic visibility adjustment based on chart timeframe
🎨 Dynamic Visual System:
- Smart Color Coding: Lines automatically change color based on price position (green above, red below)
- Customizable Styling: Adjust line thickness, transparency, and colors
- Intelligent Line Positioning: Choose between equal-length or staggered lines for better visibility
- Enhanced Labels: Display timeframe only or include price with colored background
🌈 Advanced Heatmap:
- Background coloring shows overall market sentiment across all timeframes
- Gradient or solid color modes
- Instantly see when multiple timeframes align bullish or bearish
📊 Status Table Dashboard:
- Real-time overview of all active opens
- Shows current price position relative to each open
- Simplified view when all timeframes align
- Customizable position and font style
⚙️ Professional Tools:
- Alert system for new open levels
- Extended hours session support
- Price discovery mode for EOD/intraday discrepancies
- Left/right line extensions for enhanced visibility
💡 Trading Applications
Support & Resistance:
Opening prices act as natural support/resistance levels. Price often reacts at these levels, providing entry/exit opportunities.
Trend Confirmation:
When price is above multiple opens (especially higher timeframes), it confirms bullish momentum. The opposite indicates bearish pressure.
Mean Reversion:
Price tends to revert to significant opens, particularly daily and weekly levels. Use these as targets for counter-trend trades.
Breakout Trading:
Monitor when price breaks above/below clustered opens for potential continuation moves.
Risk Management:
Use opens as logical stop-loss levels or position sizing references based on distance from key opens.
🔧 Indicator Settings
Timeframes Section:
- Toggle each timeframe on/off
- Customize individual colors
Visual Style Section:
- Dynamic Colors: Auto-color based on price position
- Line Thickness: 1-4 pixels
- Transparency: 0-80%
- Extension Length: How far lines extend right
- Label Style: Plain or enhanced with price
Heatmap Section:
- Enable/disable background coloring
- Adjust transparency
- Choose gradient or solid zones
Status Table Section:
- Position on chart
- Font selection
Advanced Section:
- Enable alerts for new opens
- Price discovery mode
- Extended hours inclusion
]📈 Best Practices
1. Timeframe Selection:
- For intraday: Focus on 1H, 4H, and Daily
- For swing trading: Daily, Weekly, Monthly
- For position trading: Monthly, Quarterly, Yearly
2. Color Coding:
- Enable dynamic colors for instant sentiment reading
- Use heatmap for overall market bias
3. Confluence Zones:
- Pay special attention when multiple opens cluster
- These zones often produce stronger reactions
4. Alignment Signals:
- When all timeframes show same color = strong trend
- Mixed colors = potential consolidation or reversal zone
🎯 Pro Tips
- Volume Confirmation: Combine with volume indicators to confirm reactions at open levels
- Multiple Instruments: Compare opens across correlated assets for divergences
- News Events: Opens often act as magnets after major news releases
- Options Trading: Weekly and monthly opens align with options expiry levels
- Algorithmic Levels: Many algorithms use these opens for entries/exits
🔄 Updates in Version 8.3
- Added 1H and 4H timeframe support
- Enhanced dynamic color system
- Implemented heatmap visualization
- Added real-time status table
- Optimized performance for smoother operation
- Improved label styling options
- Better yearly timeframe detection
⚡ Performance Optimizations
This indicator uses advanced Pine Script v6 features for optimal performance:
- Efficient object reuse instead of recreation
- Smart calculation loops
- Minimal repainting
- Optimized for real-time updates
📝 Notes
- Works on all markets (stocks, forex, crypto, futures)
- Best on timeframes lower than the opens you're tracking
- Lines automatically hide when their timeframe is lower than chart timeframe
- Past opens are not displayed (indicator shows current opens only)
🙏 Credits & Support
Created by HAZED | Version 8.3
Optimized for TradingView Pine Script v6
For questions, suggestions, or bug reports, please comment below.
If you find this indicator useful, please consider leaving a like and a follow!
Remember: No indicator is perfect. Always use proper risk management and combine multiple confirmation signals in your trading decisions.

ICT Killzones Pro Suite — ICT & SMC Indicator with AlertsThe ICT Killzones Pro Suite is a complete ICT and Smart Money Concepts (SMC) indicator that brings together the most important institutional concepts into one single tool.
Instead of manually drawing sessions, structure breaks, liquidity levels or imbalances, this ICT indicator for TradingView automatically plots them with precision and full customization.
It is widely used by traders in Forex, Indices, Crypto and Commodities who want to study market structure the same way institutions do.
🔎 Features
✅ Killzones (Asia, London, New York)
Session boxes with customizable colors
50% midline level for equilibrium reference
Real-time status display (“In Killzone” / “Out of Killzone”)
✅ Equal Highs & Equal Lows (Liquidity zones)
Automatic detection of EQH/EQL
Equality tolerance parameter
Zone expiry (bars)
Rejection filter (2 consecutive closes)
Option to show only the latest active EQH/EQL
✅ Break of Structure (BOS) & Market Structure Shift (MSS)
Detects continuation (BOS) and reversal (MSS) structures
Customizable line styles and colors
“Body only” or “Body/Wick” break modes
Option to show only the latest signals
✅ Open Price Range (OPR)
Institutional daily open level in UTC
Historical OPR memory for backtesting
Optional labels for quick identification
✅ Previous Highs and Lows
Daily (PDH/PDL), Weekly (PWH/PWL), Monthly (PMH/PML)
Full label system
Customizable line width/style
Breakout alerts for each level
✅ Fair Value Gaps (FVGs)
Automatic imbalance detection
Wick or body detection modes
Highlighted imbalance candles in yellow
✅ Alerts Engine
One global alert condition
Modular alerts:
• Killzone opens/closes
• EQH/EQL created or broken
• BOS/MSS bullish & bearish signals
• Previous Highs/Lows breakouts
• FVGs
⚙️ Parameters Explained
Killzones: start/end times in UTC, colors, extension lines, 50% midline
EQH/EQL: tolerance (0 = strict equality, >0 = margin allowed), expiry age (bars), rejection filter, body/wick break type, latest only toggle
BOS/MSS: swing bars (pivots), body vs wick detection, line styles & widths, only-latest option
OPR: exact UTC time (HH:MM), history toggle, label size/color
Previous Highs/Lows: daily/weekly/monthly levels, line styles, label settings, breakout alerts
FVGs: wick vs body detection, candle highlight color
Alerts: global condition + per-module toggles (sessions, liquidity, BOS/MSS, FVG)
Every parameter is fully customizable, making this SMC indicator adaptable to any trading style or timeframe.
📌 Why use this ICT & SMC indicator?
Saves time by automating repetitive tasks
Provides an institutional framework directly on charts
Keeps analysis structured and consistent
Optimized for intraday scalping and swing trading
⚠️ Disclaimer
This script is for educational purposes only. It does not guarantee profits or predict markets with certainty. Always use proper risk management.
🔑 Access
This is an invite-only script on TradingView.
Click Request Access on this page to apply.

VWAP Momentum Oscillator How It Works
Core Calculation Method
The oscillator combines four key market measurements into a single, normalized reading:
1. Price-VWAP Deviation: `(Close - VWAP) / VWAP × 100`
2. VWAP-MA Momentum: `(VWAP - MovingAverage) / MovingAverage × 100`
3. Anchored VWAP Strength: Average of high/low anchor deviations from rolling VWAP
4. Range Position: `(Close - PeriodLow) / (PeriodHigh - PeriodLow) × 100 - 50`
Dynamic Signal Line
The signal line uses an EMA that automatically adjusts its length based on your chart timeframe:
- Futures: Always covers 23 hours of trading (1,380 minutes)
- Stocks: Always covers 6.5 hours of trading (390 minutes)
- Examples: 276 periods on 5-min futures chart, 1,380 periods on 1-min futures chart
Trading Signals
🟢 Buy Signals
- Condition: Main oscillator crosses above signal line while below zero
- Logic: Momentum turning bullish from oversold conditions
- Visual: Green "BUY" label below price action
🔴 Sell Signals
- Condition: Main oscillator crosses below signal line while above zero
- Logic: Momentum turning bearish from overbought conditions
- Visual: Red "SELL" label above price action
⚠️ Extreme Warnings
- Extreme Overbought: Red triangle when oscillator crosses above +4.0
- Extreme Oversold: Green triangle when oscillator crosses below -4.0
- Purpose: Risk management alerts, not entry/exit signals
Oscillator Zones
Interpretation Guide
- Above +2.0: Strong bullish momentum zone (green background)
- 0 to +2.0: Mild bullish territory
- 0 to -2.0: Mild bearish territory
- Below -2.0: Strong bearish momentum zone (red background)
- Above +4.0: Extreme overbought (caution advised)
- Below -4.0: Extreme oversold (potential reversal zone)
Customization Options
Moving Average Settings
- EMA/SMA Toggle: Choose between exponential or simple moving average
- Color Customization: Adjust MA line color and width
Visual Controls
- Bullish/Bearish Colors: Customize momentum zone colors
- Signal Line: Toggle visibility and adjust color
- Line Widths: Control thickness of all plot lines
Anchor Modes
- NY Session Only: Anchors reset at NY market open (9:30 AM ET)
- 24H NY Day: Anchors reset at NY calendar day change (midnight ET)
Best Practices
Timeframe Selection
- Scalping: 1-5 minute charts for quick momentum changes
- Day Trading: 5-15 minute charts for clearer trend signals
- Swing Trading: 1-4 hour charts for major momentum shifts
Signal Confirmation
- Wait for crossovers: Don't trade on oscillator position alone
- Respect extreme levels: Exercise caution above +4 or below -4
- Use with price action: Combine with support/resistance levels
Risk Management
- Extreme zones: Reduce position size when oscillator is extended
- Failed signals: Exit quickly if momentum doesn't follow through
- Market context: Consider overall trend direction and market volatility
Technical Specifications
Calculation Components
- Base Length: 1,380 periods (futures) / 390 periods (stocks)
- Signal Line: Dynamic EMA covering one full trading day
- Smoothing: 3-period SMA on raw oscillator (adjustable)
- Update Frequency: Real-time on every price tick
Performance Notes
- Resource Efficient: Optimized calculations minimize CPU usage
- Memory Friendly: Uses incremental VWAP calculations
- Fast Loading: Minimal historical data requirements
Version History & Development
This oscillator evolved from advanced VWAP overlay strategies, transforming complex multi-line analysis into a single, actionable momentum gauge. The indicator maintains the sophistication of institutional VWAP analysis while providing the clarity needed for retail trading decisions.
Core Philosophy
Traditional VWAP indicators show where price is relative to volume-weighted averages, but they don't quantify momentum or provide clear entry/exit signals. This oscillator solves that problem by normalizing all VWAP relationships into a single, bounded indicator that works consistently across all timeframes and asset classes.
---
Open Source License: This indicator is provided free for the TradingView community. Feel free to modify and enhance according to your trading needs.

Universal Valuation ~ GForge
🎯 Universal Valuation - GForge
Overview:
The Universal Valuation indicator is a sophisticated technical analysis tool that combines 14 different technical indicators into a single, normalized composite Z-score. This revolutionary approach provides traders and investors with a comprehensive view of an asset's relative valuation state, helping identify potential overvalued and undervalued conditions across any market, any timeframe .
🌟 Key Features:
Multi-Indicator Fusion: Combines RSI, CCI, Bollinger Bands, Price Analysis, Chande Momentum, Disparity Index, Hurst Exponent, IMI, TEMA, VWAP, Intraday Momentum, and advanced Risk Ratios (Sharpe, Sortino, Omega)
Universal Compatibility: Works seamlessly across stocks, forex, crypto, commodities, indices, and any tradeable asset
Multi-Timeframe Support: Optimized for all timeframes from 1-minute scalping to monthly long-term analysis
Professional Visualization: 9 stunning color themes with gradient effects and customizable styling
Comprehensive Dashboard: Real-time table displaying individual indicator scores and overall valuation phase
Smart Alert System: Built-in notifications for extreme valuation conditions
Z-Score Normalization: All indicators standardized for consistent comparison and interpretation
🔬 Technical Methodology:
The indicator employs advanced statistical normalization using Z-scores to transform disparate technical indicators into a unified measurement system. This revolutionary approach solves the fundamental problem of combining indicators with different scales and ranges.
1H MNT
Z-Score Normalization Process:
Raw Calculation: Each indicator is first calculated using its traditional formula (RSI 0-100, CCI unlimited range, etc.)
Statistical Analysis: For each indicator, the system calculates a rolling mean and standard deviation over a customizable lookback period
Z-Score Conversion: Current reading is converted using: Z = (Current Value - Rolling Mean) / Rolling Standard Deviation
Standardization: All Z-scores are clamped between -5 and +5 to prevent extreme outliers from dominating the composite
Democratic Weighting: Each normalized indicator contributes equally to the final composite score
Composite Calculation: Final score = Sum of all active Z-scores / Number of active indicators
Why Z-Scores Make It Universal:
Z-scores transform any indicator reading into "how many standard deviations away from normal this reading is." This means:
• An RSI of 85 on a volatile crypto might have the same Z-score as an RSI of 75 on a stable stock
• A CCI reading of +200 in a trending market might be less extreme than +100 in a ranging market
• Price movements are automatically adjusted for each asset's historical volatility
• Different timeframes are automatically normalized for their typical volatility patterns
This mathematical approach ensures the indicator adapts to any asset's unique characteristics and market conditions.
📊 Detailed Component Analysis:
Technical Indicators:
RSI (Relative Strength Index):
Calculates momentum by comparing recent gains to recent losses over a customizable period (default 21). Values above 70 traditionally indicate overbought conditions, while values below 30 suggest oversold conditions. The Universal Valuation converts these raw RSI values into Z-scores, providing a normalized view of how extreme current RSI readings are compared to historical patterns.
CCI (Commodity Channel Index):
Measures the current price level relative to an average price level over a given period (default 30). CCI compares the typical price (high+low+close)/3 to its simple moving average and divides by the mean absolute deviation. Values above +100 or below -100 indicate price extremes. Our Z-score normalization helps identify when CCI readings are statistically significant.
Bollinger Bands Position:
Calculates where the current price sits within the Bollinger Bands envelope. A value of +1 means price is at the upper band, -1 at the lower band, and 0 at the middle (SMA). This component measures price deviation from the mean in standard deviation units, making it naturally statistical. The Z-score normalization reveals when band position readings are historically extreme.
Price Z-Score:
Direct statistical measurement of how far the current price deviates from its historical mean in standard deviation units. This is the purest form of valuation measurement, showing whether an asset is trading at statistically significant levels relative to its historical price range.
Momentum Indicators:
Chande Momentum Oscillator (CMO):
Unlike RSI, CMO uses the sum of gains and losses rather than averages, making it more sensitive to recent price changes. It calculates (sum of gains - sum of losses) / (sum of gains + sum of losses) × 100. Values range from -100 to +100. The Z-score normalization helps identify when momentum readings are unusually extreme.
Disparity Index:
Measures the percentage difference between current price and its simple moving average: (Price - SMA) / SMA × 100. This shows how far price has deviated from its average, with positive values indicating price above average and negative values below. Z-score normalization reveals when these deviations are statistically significant.
Intraday Momentum Index (IMI):
Similar to RSI but uses intraday price movements instead of closing prices. It compares gains and losses within each session (close vs open) rather than session-to-session changes. This captures intraday sentiment and momentum that closing-based indicators might miss. Particularly useful for detecting intraday reversal patterns.
Intraday Momentum:
Simple but effective measurement of daily price movement: (Close - Open) / Open × 100. This shows the percentage gain or loss within each trading session. When Z-score normalized, it reveals when intraday movements are historically extreme, often indicating climax buying or selling conditions.
Advanced Indicators:
TEMA (Triple Exponential Moving Average):
A sophisticated moving average that applies exponential smoothing three times to reduce lag while maintaining responsiveness. TEMA = 3×EMA₁ - 3×EMA₂ + EMA₃, where each EMA is applied to the previous result. The Z-score of TEMA helps identify when price has moved significantly away from this responsive trend line.
VWAP (Volume Weighted Average Price):
Calculates the average price weighted by volume, giving more importance to prices where more volume occurred. VWAP = Σ(Price × Volume) / Σ(Volume). This represents the "fair value" based on actual trading activity. Z-score normalization shows when current VWAP is statistically extreme relative to historical VWAP levels.
Hurst Exponent:
Advanced mathematical concept measuring market efficiency and trend persistence. Values near 0.5 indicate random walk (efficient market), above 0.5 suggest trending behavior, and below 0.5 indicate mean-reverting markets. The indicator converts this to an oscillator: (Hurst - 0.5) × 100, then applies Z-score normalization to identify extreme efficiency/inefficiency periods.
Risk Ratios:
Sharpe Ratio:
Classic risk-adjusted return measure: (Return - Risk-free Rate) / Standard Deviation of Returns. Higher values indicate better risk-adjusted performance. The Z-score normalization reveals when current risk-adjusted returns are historically high or low, helping identify periods of exceptional or poor risk-adjusted performance.
Sortino Ratio:
Improvement over Sharpe ratio that only penalizes downside volatility: (Return - Risk-free Rate) / Downside Deviation. This gives a more accurate picture of risk-adjusted returns since upside volatility isn't necessarily bad. Z-score normalization helps identify when downside risk-adjusted returns reach extreme levels.
Omega Ratio:
Sophisticated risk measure that considers the probability-weighted ratio of gains versus losses above a threshold: Σ(Gains above threshold) / Σ(Losses below threshold). Values above 1.0 indicate positive expected returns above the threshold. Z-score normalization reveals when probability-weighted risk/reward ratios reach historically significant levels.
🎨 Valuation Phases:
The composite Z-score translates into clear valuation phases:
🔵 Extremely Undervalued: Z-Score ≤ -2.0 (Rare buying opportunities)
🟦 Strongly Undervalued: Z-Score ≤ -1.3 (Strong buying signals)
🟨 Moderately Undervalued: Z-Score ≤ -0.65 (Potential value plays)
⚪ Fairly Valued: Z-Score -0.65 to 0.5 (Neutral territory)
🟨 Slightly Overvalued: Z-Score 0.5 to 1.2 (Caution advised)
🟧 Moderately Overvalued: Z-Score 1.2 to 2.0 (Consider profit-taking)
🔴 Strongly Overvalued: Z-Score > 2.0 (High risk, potential sell signals)
12H GOLD
🌍 Universal Application:
Why "Universal"?
Timeframe Independent: Statistical normalization adapts to any timeframe's volatility characteristics
Market Neutral: Works across different market conditions (trending, ranging, volatile, calm)
Configurable Components: Enable/disable specific indicators based on asset type and market conditions
Adaptive Parameters: All lookback periods are customizable for different trading styles
💡 Optimal Use Cases:
Swing Trading: Identify intermediate-term reversal points
Position Trading: Long-term value assessment for portfolio allocation
Day Trading: Intraday extreme condition alerts
Risk Management: Position sizing based on valuation extremes
Multi-Asset Analysis: Compare relative value across different instruments
Market Timing: Entry and exit point optimization
⚙️ Customization Options:
Component Selection: Enable/disable any of the 14 indicators
Lookback Periods: Adjust Z-score calculation periods for each component
Visual Themes: 9 professional color schemes plus custom colors
Alert Thresholds: Configurable extreme condition notifications
Dashboard Display: Toggle individual component visibility
Background Highlighting: Visual emphasis for extreme conditions
🎯 Interpretation Guide:
For Long Positions:
• Look for Z-scores below -1.3 for entry opportunities
• Consider profit-taking when Z-scores exceed +1.2
• Use extreme readings (< -2.0) for high-conviction entries
For Short Positions:
• Look for Z-scores above +2.0 for entry opportunities
• Cover positions when Z-scores fall below +0.5
• Avoid shorting during extreme undervaluation (< -1.3)
For Risk Management:
• Reduce position sizes during overvalued conditions
• Increase allocation during undervalued periods
• Use neutral zones (±0.5) for position adjustments
🔔 Alert System:
Built-in alerts notify you when:
Composite score enters/exits strong overvalued territory (±2.0)
Composite score enters/exits strong undervalued territory (±1.3)
Extreme conditions are reached (±2.5 for overvalued, -2.0 for undervalued)
Neutral crossovers occur (useful for trend changes)
📈 Performance Optimization:
The indicator includes several performance optimizations:
Efficient calculation methods to minimize processing load
Clamped Z-scores to prevent extreme outliers
Optimized table rendering for smooth operation
🎨 Visual Elements:
Main Plot: Composite Z-score line with dynamic gradient coloring
Zone Fills: Visual bands showing valuation regions
Reference Lines: Key threshold levels clearly marked
Background Highlighting: Extreme condition emphasis
Dashboard Table: Comprehensive component breakdown
Bar Coloring: Optional candlestick coloring based on valuation
🔧 Technical Requirements:
Requires sufficient historical data for accurate Z-score calculations
Recommended minimum: 300+ bars for optimal performance
Works on all TradingView subscription levels
📚 Educational Value:
This indicator serves as an excellent educational tool for:
Understanding statistical normalization in trading
Learning how multiple indicators can be combined effectively
Studying market valuation concepts across different assets
Developing a systematic approach to market analysis
⚠️ Important Notes:
The indicator works best with sufficient historical data
Consider market context and fundamental factors alongside technical signals
Backtest thoroughly before implementing in live trading
Adjust parameters based on specific asset characteristics and trading timeframe
Use in conjunction with other analysis methods for best results
---
⚠️ DISCLAIMER:
This indicator is provided for educational and informational purposes only and should not be considered as financial advice, investment advice, trading advice, or any other type of advice.
The Universal Valuation indicator is a technical analysis tool that provides statistical information about price movements and market conditions. It does not guarantee profits or predict future market movements with certainty.
---
Developed with precision for the TradingView community ~ GForge

BOCS AdaptiveBOCS Adaptive Strategy - Automated Volatility Breakout System
WHAT THIS STRATEGY DOES:
This is an automated trading strategy that detects consolidation patterns through volatility analysis and executes trades when price breaks out of these channels. Take-profit and stop-loss levels are calculated dynamically using Average True Range (ATR) to adapt to current market volatility. The strategy closes positions partially at the first profit target and exits the remainder at the second target or stop loss.
TECHNICAL METHODOLOGY:
Price Normalization Process:
The strategy begins by normalizing price to create a consistent measurement scale. It calculates the highest high and lowest low over a user-defined lookback period (default 100 bars). The current close price is then normalized using the formula: (close - lowest_low) / (highest_high - lowest_low). This produces values between 0 and 1, allowing volatility analysis to work consistently across different instruments and price levels.
Volatility Detection:
A 14-period standard deviation is applied to the normalized price series. Standard deviation measures how much prices deviate from their average - higher values indicate volatility expansion, lower values indicate consolidation. The strategy uses ta.highestbars() and ta.lowestbars() functions to track when volatility reaches peaks and troughs over the detection length period (default 14 bars).
Channel Formation Logic:
When volatility crosses from a high level to a low level, this signals the beginning of a consolidation phase. The strategy records this moment using ta.crossover(upper, lower) and begins tracking the highest and lowest prices during the consolidation. These become the channel boundaries. The duration between the crossover and current bar must exceed 10 bars minimum to avoid false channels from brief volatility spikes. Channels are drawn using box objects with the recorded high/low boundaries.
Breakout Signal Generation:
Two detection modes are available:
Strong Closes Mode (default): Breakout occurs when the candle body midpoint math.avg(close, open) exceeds the channel boundary. This filters out wick-only breaks.
Any Touch Mode: Breakout occurs when the close price exceeds the boundary.
When price closes above the upper channel boundary, a bullish breakout signal generates. When price closes below the lower boundary, a bearish breakout signal generates. The channel is then removed from the chart.
ATR-Based Risk Management:
The strategy uses request.security() to fetch ATR values from a specified timeframe, which can differ from the chart timeframe. For example, on a 5-minute chart, you can use 1-minute ATR for more responsive calculations. The ATR is calculated using ta.atr(length) with a user-defined period (default 14).
Exit levels are calculated at the moment of breakout:
Long Entry Price = Upper channel boundary
Long TP1 = Entry + (ATR × TP1 Multiplier)
Long TP2 = Entry + (ATR × TP2 Multiplier)
Long SL = Entry - (ATR × SL Multiplier)
For short trades, the calculation inverts:
Short Entry Price = Lower channel boundary
Short TP1 = Entry - (ATR × TP1 Multiplier)
Short TP2 = Entry - (ATR × TP2 Multiplier)
Short SL = Entry + (ATR × SL Multiplier)
Trade Execution Logic:
When a breakout occurs, the strategy checks if trading hours filter is satisfied (if enabled) and if position size equals zero (no existing position). If volume confirmation is enabled, it also verifies that current volume exceeds 1.2 times the 20-period simple moving average.
If all conditions are met:
strategy.entry() opens a position using the user-defined number of contracts
strategy.exit() immediately places a stop loss order
The code monitors price against TP1 and TP2 levels on each bar
When price reaches TP1, strategy.close() closes the specified number of contracts (e.g., if you enter with 3 contracts and set TP1 close to 1, it closes 1 contract). When price reaches TP2, it closes all remaining contracts. If stop loss is hit first, the entire position exits via the strategy.exit() order.
Volume Analysis System:
The strategy uses ta.requestUpAndDownVolume(timeframe) to fetch up volume, down volume, and volume delta from a specified timeframe. Three display modes are available:
Volume Mode: Shows total volume as bars scaled relative to the 20-period average
Comparison Mode: Shows up volume and down volume as separate bars above/below the channel midline
Delta Mode: Shows net volume delta (up volume - down volume) as bars, positive values above midline, negative below
The volume confirmation logic compares breakout bar volume to the 20-period SMA. If volume ÷ average > 1.2, the breakout is classified as "confirmed." When volume confirmation is enabled in settings, only confirmed breakouts generate trades.
INPUT PARAMETERS:
Strategy Settings:
Number of Contracts: Fixed quantity to trade per signal (1-1000)
Require Volume Confirmation: Toggle to only trade signals with volume >120% of average
TP1 Close Contracts: Exact number of contracts to close at first target (1-1000)
Use Trading Hours Filter: Toggle to restrict trading to specified session
Trading Hours: Session input in HHMM-HHMM format (e.g., "0930-1600")
Main Settings:
Normalization Length: Lookback bars for high/low calculation (1-500, default 100)
Box Detection Length: Period for volatility peak/trough detection (1-100, default 14)
Strong Closes Only: Toggle between body midpoint vs close price for breakout detection
Nested Channels: Allow multiple overlapping channels vs single channel at a time
ATR TP/SL Settings:
ATR Timeframe: Source timeframe for ATR calculation (1, 5, 15, 60, etc.)
ATR Length: Smoothing period for ATR (1-100, default 14)
Take Profit 1 Multiplier: Distance from entry as multiple of ATR (0.1-10.0, default 2.0)
Take Profit 2 Multiplier: Distance from entry as multiple of ATR (0.1-10.0, default 3.0)
Stop Loss Multiplier: Distance from entry as multiple of ATR (0.1-10.0, default 1.0)
Enable Take Profit 2: Toggle second profit target on/off
VISUAL INDICATORS:
Channel boxes with semi-transparent fill showing consolidation zones
Green/red colored zones at channel boundaries indicating breakout areas
Volume bars displayed within channels using selected mode
TP/SL lines with labels showing both price level and distance in points
Entry signals marked with up/down triangles at breakout price
Strategy status table showing position, contracts, P&L, ATR values, and volume confirmation status
HOW TO USE:
For 2-Minute Scalping:
Set ATR Timeframe to "1" (1-minute), ATR Length to 12, TP1 Multiplier to 2.0, TP2 Multiplier to 3.0, SL Multiplier to 1.5. Enable volume confirmation and strong closes only. Use trading hours filter to avoid low-volume periods.
For 5-15 Minute Day Trading:
Set ATR Timeframe to match chart or use 5-minute, ATR Length to 14, TP1 Multiplier to 2.0, TP2 Multiplier to 3.5, SL Multiplier to 1.2. Volume confirmation recommended but optional.
For Hourly+ Swing Trading:
Set ATR Timeframe to 15-30 minute, ATR Length to 14-21, TP1 Multiplier to 2.5, TP2 Multiplier to 4.0, SL Multiplier to 1.5. Volume confirmation optional, nested channels can be enabled for multiple setups.
BACKTEST CONSIDERATIONS:
Strategy performs best during trending or volatility expansion phases
Consolidation-heavy or choppy markets produce more false signals
Shorter timeframes require wider stop loss multipliers due to noise
Commission and slippage significantly impact performance on sub-5-minute charts
Volume confirmation generally improves win rate but reduces trade frequency
ATR multipliers should be optimized for specific instrument characteristics
COMPATIBLE MARKETS:
Works on any instrument with price and volume data including forex pairs, stock indices, individual stocks, cryptocurrency, commodities, and futures contracts. Requires TradingView data feed that includes volume for volume confirmation features to function.
KNOWN LIMITATIONS:
Stop losses execute via strategy.exit() and may not fill at exact levels during gaps or extreme volatility
request.security() on lower timeframes requires higher-tier TradingView subscription
False breakouts inherent to breakout strategies cannot be completely eliminated
Performance varies significantly based on market regime (trending vs ranging)
Partial closing logic requires sufficient position size relative to TP1 close contracts setting
RISK DISCLOSURE:
Trading involves substantial risk of loss. Past performance of this or any strategy does not guarantee future results. This strategy is provided for educational purposes and automated backtesting. Thoroughly test on historical data and paper trade before risking real capital. Market conditions change and strategies that worked historically may fail in the future. Use appropriate position sizing and never risk more than you can afford to lose. Consider consulting a licensed financial advisor before making trading decisions.
ACKNOWLEDGMENT & CREDITS:
This strategy is built upon the channel detection methodology created by AlgoAlpha in the "Smart Money Breakout Channels" indicator. Full credit and appreciation to AlgoAlpha for pioneering the normalized volatility approach to identifying consolidation patterns and sharing this innovative technique with the TradingView community. The enhancements added to the original concept include automated trade execution, multi-timeframe ATR-based risk management, partial position closing by contract count, volume confirmation filtering, and real-time position monitoring.

ICT Turtle Soup (Riz)The ICT Turtle Soup Complete System is an advanced implementation of the Inner Circle Trader's interpretation of the classic Turtle Soup pattern, designed to identify and trade liquidity sweeps at key market levels. This strategy capitalizes on the systematic stop-loss hunting behavior of institutional traders by detecting when price temporarily breaches significant support/resistance levels to trigger retail stop-losses, then quickly reverses direction.
Core Trading Logic
Liquidity Sweep Detection Method
The strategy monitors five critical liquidity pools where retail traders commonly place stop-loss orders:
⦁ Yesterday's High/Low: Previous daily session extremes
⦁ Daily High/Low: Rolling 20-day period extremes
⦁ 4-Hour High/Low: 30-period extremes on 4H timeframe
⦁ 1-Hour High/Low: 50-period extremes on hourly timeframe
⦁ Recent High/Low: Current timeframe extremes (20-40 bars based on trading mode)
Entry Signal Generation Process
Buy Signal (Sell-Side Liquidity Sweep):
1. Price penetrates below a key support level by a minimum threshold (5-15 ticks depending on signal quality settings)
2. The penetration bar must show strong rejection with at least 30-50% of the candle's range closing back above the swept level
3. Multi-timeframe confirmation checks for structure shift on lower timeframe (break of recent swing high)
4. Confluence scoring system evaluates 7 factors, requiring minimum 3 confirmations:
⦁ Liquidity sweep detected (weighted 2x)
⦁ Higher timeframe bullish market structure
⦁ Lower timeframe bullish break of structure
⦁ Bullish Fair Value Gap presence
⦁ Bullish Order Block formation
⦁ ICT Kill Zone timing alignment
Sell Signal (Buy-Side Liquidity Sweep):
Mirror opposite of buy signal logic, detecting sweeps above resistance levels with bearish rejection.
Risk Management & Position Sizing
Stop Loss Placement:
⦁ Calculated using ATR (Average True Range) multiplied by an adaptive factor
⦁ Base multipliers: Scalping (1.0x), Day Trading (1.5x), Swing Trading (2.0x)
⦁ Further adjusted by signal quality: Conservative (-20%), Balanced (0%), Aggressive (+20%)
⦁ Positioned beyond the liquidity sweep point to avoid re-sweeping
Take Profit Targets:
⦁ TP1: 2.0R (Risk-Reward ratio)
⦁ TP2: 3.5R
⦁ TP3: 5.0R
⦁ All levels rounded to tick precision for accurate order placement
Advanced Features & Filters
Multi-Timeframe Structure Analysis
The system performs top-down analysis across three timeframes:
⦁ Higher Timeframe (HTF): Determines primary trend bias
⦁ Medium Timeframe (MTF): Confirms intermediate structure
⦁ Lower Timeframe (LTF): Identifies precise entry triggers
ICT Kill Zones
Incorporates time-based filtering for optimal trading sessions:
⦁ Asian Session (8PM-12AM UTC)
⦁ London Session (2AM-5AM UTC)
⦁ New York Session (7AM-10AM UTC)
⦁ London Close (10AM-12PM UTC)
Smart Money Concepts Integration
⦁ Fair Value Gaps (FVG): Identifies and displays price inefficiencies that act as magnets
⦁ Order Blocks: Marks institutional accumulation/distribution zones
⦁ Mitigation Detection: Automatically removes FVGs and Order Blocks when price fills them
⦁ Duplicate Sweep Prevention: 10-bar lookback prevents multiple signals at same level
Adaptive Trading Modes
Three pre-configured modes automatically adjust all parameters:
⦁ Scalping: Tight stops, quick targets, 15-minute to 1-hour focus
⦁ Day Trading: Balanced approach, 4-hour to daily analysis
⦁ Swing Trading: Wide stops, extended targets, daily to weekly perspective
⦁ Custom Mode: Full manual control of all parameters
Signal Quality Management
⦁ Conservative: Requires 5/7 confluence factors, tighter sweep threshold (5 ticks), 50% minimum rejection
⦁ Balanced: Standard 3/7 confluence, moderate threshold (10 ticks), 30% rejection
⦁ Aggressive: Only 2/7 confluence needed, wider threshold (15 ticks), 20% rejection
Visual Components & Dashboard
Real-Time Information Panel
Displays current market conditions including:
⦁ Active trading mode and quality settings
⦁ Timeframe configuration (HTF/MTF/LTF)
⦁ Market bias from higher timeframes
⦁ Current kill zone status
⦁ Liquidity sweep detection status
⦁ Confluence scoring for both directions
⦁ Risk parameters and targets
Trade Visualization
⦁ Entry, stop-loss, and three take-profit levels with precise price labels
⦁ Automatic cleanup when targets are hit or new signals appear
⦁ Maximum of one active setup displayed for chart clarity
⦁ Color-coded boxes for Fair Value Gaps and Order Blocks
How to Use This Indicator
Recommended Timeframes
⦁ Scalping Mode: 1-minute to 5-minute charts
⦁ Day Trading Mode: 5-minute to 15-minute charts
⦁ Swing Trading Mode: 1-hour to 4-hour charts
Optimal Market Conditions
⦁ Works best in ranging or trending markets with clear support/resistance levels
⦁ Most effective during high-liquidity sessions (London/New York overlap)
⦁ Avoid using during major news events unless specifically targeting news-driven sweeps
Signal Interpretation
1. Wait for triangle signal (up/down) with confluence score
2. Verify the swept level shown in the dashboard
3. Confirm risk-reward ratios match your trading plan
4. Enter at market or set limit order at indicated entry level
5. Place stop-loss and take-profit orders at displayed levels
Customization Tips
⦁ Adjust Signal Quality based on market volatility (Conservative for volatile, Aggressive for quiet)
⦁ Modify sweep threshold if getting too many/few signals
⦁ Toggle individual liquidity levels based on their relevance to your timeframe
⦁ Use Kill Zone filter for session-specific trading
Risk Disclaimer
This indicator identifies potential trade setups based on liquidity sweep patterns but does not guarantee profitable outcomes. Past performance does not indicate future results. Always use proper risk management and never risk more than you can afford to lose. The indicator should be used as part of a comprehensive trading plan that includes your own analysis and risk tolerance assessment.

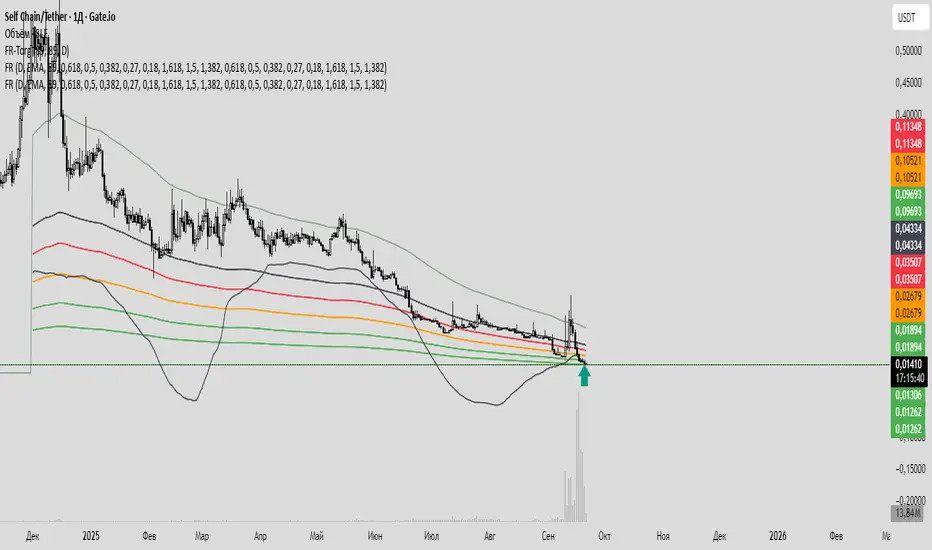
Fiery River### Description of the "Fiery River" (FR) Indicator
**Overview of the Indicator**
"Fiery River" (abbreviated as FR) is a technical indicator for TradingView, written in Pine Script version 6. It's designed for traders who incorporate Fibonacci levels with moving averages to analyze support and resistance zones. The indicator dynamically plots levels based on a selected moving average (MA) and Fibonacci multipliers, displaying them on the current timeframe and an additional secondary timeframe. This helps visualize potential reversal or continuation points, making analysis more comprehensive. The name "Fiery River" evokes a "fiery" flow of levels that "stream" across the chart, adapting to price movements. 🔥
**Key Features**
- **Level Construction**: The indicator calculates a moving average (EMA, SMA, WMA, RMA, or HMA) from the closing price and multiplies it by specified Fibonacci coefficients (0.618, 0.5, 0.382, 0.27, 0.18 for "long" levels and 1.618, 1.5, 1.382 for "short" levels). This creates 10 lines: 5 for the current timeframe (fully visible) and 5 for the secondary timeframe (with semi-transparency for distinction).
- **Color Scheme**: Levels are colored in gray, red, orange, and green, with additional "short" variants for extensions.
- **Fills**: Green fills are added between level pairs to highlight areas of interest, making the chart more visually intuitive.
- **Alerts**: Automatic notifications when the price touches levels (e.g., "Price touches Red line"), helping you stay on top of key moments.
- **Multi-Timeframe Support**: Incorporates a secondary timeframe (e.g., daily if the main is hourly) for comparing levels across different scales.
**How to Use**
1. Add the indicator to your chart in TradingView.
2. Customize settings in the panel: Select MA type, period (default 89), secondary timeframe, and Fibonacci coefficients.
3. Analyze levels as potential entry/exit points: Gray and red for stronger zones, green for weaker ones. Use fills to identify ranges.
4. Enable alerts for real-time signals.
It's ideal for strategies based on Fibonacci and trends, but always combine with other tools for confirmation. 📈
**Advantages and Limitations**
- **Pros**: Highly customizable, visually clear, supports multiple MA types and timeframes. Great for scalping and swing trading.
- **Cons**: Can create a lot of lines on the chart, potentially overwhelming if not managed. May require testing for optimal settings on volatile assets.
If you need any adjustments, more details, or help with the code, just let me know! 😊
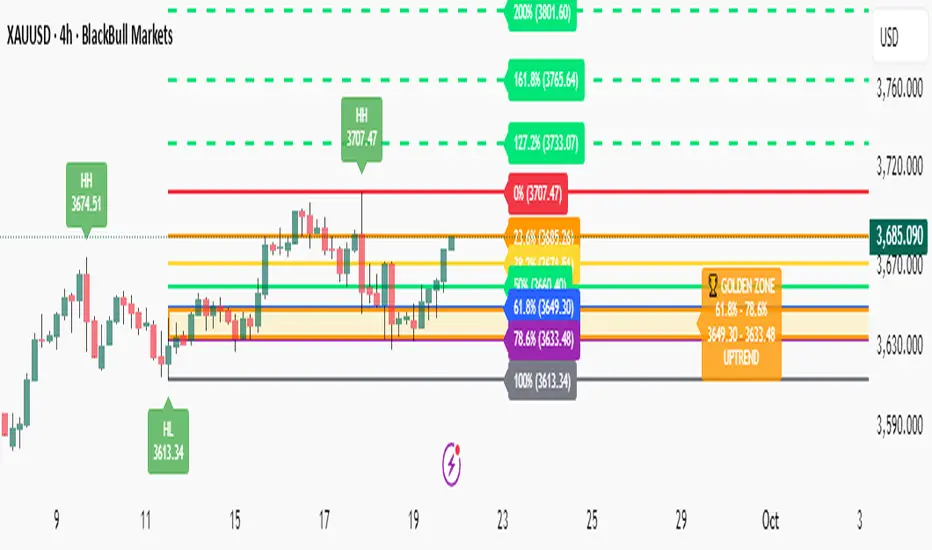
Fibonacci with Golden Zone - Trend Aware🎯 What This Indicator Does:
This advanced Fibonacci tool automatically detects trend direction and adapts Golden Zone calculations accordingly, providing dynamic support/resistance levels with market structure analysis.
✨ Key Features:
🔄 Trend-Aware Golden Zone: Automatically adjusts 61.8%-78.6% zone based on market direction
📈 Market Structure Labels: Shows HH, HL, LH, LL patterns with price levels
🎯 Smart Fibonacci Levels: Retracements (0%, 23.6%, 38.2%, 50%, 61.8%, 78.6%, 100%)
🚀 Extension Targets: 127.2%, 161.8%, 200%, 261.8% projections
📊 Pivot Points: Optional daily/weekly pivot levels
🔔 Smart Alerts: Golden Zone entry and extension target alerts
🧠 How It Works:
Uptrend: Golden Zone acts as support (retracement from swing high)
Downtrend: Golden Zone acts as resistance (retracement from swing low)
Auto-Detection: Uses trend MA to determine market direction
Structure Analysis: Identifies swing patterns for better entries
⚙️ Settings:
Lookback Period: Swing detection sensitivity (5-50)
Trend Period: Moving average for trend detection (20-200)
Golden Zone: Toggle 61.8%-78.6% zone display
Market Structure: Show HH/HL/LH/LL labels
Pivot Points: Optional daily pivot levels
📋 Best Use Cases:
🥇 Gold/Forex Trading: Perfect for XAUUSD analysis
📈 Swing Trading: Identify key reversal zones
🎯 Target Setting: Extension levels for profit taking
📊 Trend Following: Align trades with market direction
🎨 Visual Features:
🟡 Golden Zone Box: Highlighted support/resistance area
🏷️ Price Labels: Exact levels on all Fibonacci lines
🎨 Color Coding: Green for uptrend, Red for downtrend
📱 Clean Interface: Professional, non-cluttered design
🔔 Alert System:
🏆 Price entering Golden Zone
🎯 Approaching extension targets (127.2%, 161.8%)
📊 Includes trend direction in alerts
Advanced Trading System - [WOLONG X DBG]Advanced Multi-Timeframe Trading System
Overview
This technical analysis indicator combines multiple established methodologies to provide traders with market insights across various timeframes. The system integrates SuperTrend analysis, moving average clouds, MACD-based candle coloring, RSI analysis, and multi-timeframe trend detection to suggest potential entry and exit opportunities for both swing and day trading approaches.
Methodology
The indicator employs a multi-layered analytical approach based on established technical analysis principles:
Core Signal Generation
SuperTrend Engine: Utilizes adaptive SuperTrend calculations with customizable sensitivity (1-20) combined with SMA confirmation filters to identify potential trend changes and continuations
Braid Filter System: Implements moving average filtering using multiple MA types (McGinley Dynamic, EMA, DEMA, TEMA, Hull, Jurik, FRAMA) with percentage-based strength filtering to help reduce false signals
Multi-Timeframe Analysis: Analyzes trend conditions across 10 different timeframes (1-minute to Daily) using EMA-based trend detection for broader market context
Advanced Features
MACD Candle Coloring: Applies dynamic 4-level candle coloring system based on MACD histogram momentum and signal line relationships for visual trend strength assessment
RSI Analysis: Identifies potential reversal areas using RSI oversold/overbought conditions with SuperTrend confirmation
Take Profit Analysis: Features dual-mode TP detection using statistical slope analysis and Parabolic SAR integration for exit timing analysis
Key Components
Signal Types
Primary Signals: Green ▲ for potential long entries, Red ▼ for potential short entries with trend and SMA alignment
Reversal Signals: Small circular indicators for RSI-based counter-trend possibilities
Take Profit Markers: X-cross symbols indicating statistical TP analysis zones
Pullback Signals: Purple arrows for potential trend continuation entries using Parabolic SAR
Visual Elements
8-Layer MA Cloud: Customizable moving average cloud system with 3 color themes for trend visualization
Real-Time Dashboard: Multi-timeframe trend analysis table showing bullish/bearish status across all timeframes
Dynamic Candle Colors: 4-intensity MACD-based coloring system (ranging from light to strong trend colors)
Entry/SL/TP Labels: Automatic calculation and display of suggested entry points, stop losses, and multiple take profit levels
Usage Instructions
Basic Configuration
Sensitivity Setting: Start with default value 6
Increase (7-15) for more frequent signals in volatile markets
Decrease (3-5) for higher quality signals in trending markets
MA Filter Type: McGinley Dynamic recommended for smoother signals
Filter Strength: Set to 80% for balanced filtering, adjust based on market conditions
Signal Interpretation
Long Entry: Green ▲ suggests when price crosses above SuperTrend with bullish SMA alignment
Short Entry: Red ▼ suggests when price crosses below SuperTrend with bearish SMA alignment
Reversal Opportunities: Small circles indicate RSI-based counter-trend analysis
Take Profit Zones: X-crosses mark statistical TP areas based on slope analysis
Dashboard Analysis
Green Cells: Bullish trend detected on that timeframe
Red Cells: Bearish trend detected on that timeframe
Multi-Timeframe Confluence: Look for alignment across multiple timeframes for stronger signal confirmation
Risk Management Features
Automatic Calculations
ATR-Based Stop Loss: Dynamic stop loss calculation using ATR multiplier (default 1.9x)
Multiple Take Profit Levels: Three TP targets with 1:1, 1:2, and 1:3 risk-reward ratios
Position Sizing Guidance: Entry labels display suggested price levels for order placement
Confirmation Requirements
Trend Alignment: Requires SuperTrend and SMA confirmation before signal generation
Filter Validation: Braid filter must show sufficient strength before signals activate
Multi-Timeframe Context: Dashboard provides broader market context for decision making
Optimal Settings
Timeframe Recommendations
Scalping: 1M-5M charts with sensitivity 8-12
Day Trading: 15M-1H charts with sensitivity 6-8
Swing Trading: 4H-Daily charts with sensitivity 4-6
Market Conditions
Trending Markets: Reduce sensitivity, increase filter strength
Ranging Markets: Increase sensitivity, enable reversal signals
High Volatility: Adjust ATR risk factor to 2.0-2.5
Advanced Features
Customization Options
MA Cloud Periods: 8 customizable periods for cloud layers (default: 2,6,11,18,21,24,28,34)
Color Themes: Three professional color schemes plus transparent option
Dashboard Position: 9 positioning options with 4 size settings
Signal Filtering: Individual toggle controls for each signal type
Technical Specifications
Moving Average Types: 21 different MA calculations including advanced types (Jurik, FRAMA, VIDA, CMA)
Pullback Detection: Parabolic SAR with customizable start, increment, and maximum values
Statistical Analysis: Linear regression slope calculation for trend-based TP analysis
Important Limitations
Lagging Nature: Some signals may appear after potential entry points due to confirmation requirements
Ranging Markets: May produce false signals during extended sideways price action
High Volatility: Requires parameter adjustment during news events or unusual market conditions
Computational Load: Multiple timeframe analysis may impact performance on slower devices
No Guarantee: All signals are suggestions based on technical analysis and may be incorrect
Educational Disclaimers
This indicator is designed for educational and analytical purposes only. It represents a technical analysis tool based on mathematical calculations of historical price data and should not be considered as financial advice or trading recommendations.
Risk Warning: Trading involves substantial risk of loss and is not suitable for all investors. Past performance of any trading system or methodology is not necessarily indicative of future results. The high degree of leverage can work against you as well as for you.
Important Notes:
Always conduct your own analysis before making trading decisions
Use appropriate position sizing and risk management strategies
Never risk more than you can afford to lose
Consider your investment objectives, experience level, and risk tolerance
Seek advice from qualified financial professionals when needed
Performance Disclaimer: Backtesting results do not guarantee future performance. Market conditions change constantly, and what worked in the past may not work in the future. Always paper trade new strategies before risking real capital.

[delta2win] ShockSentinel Early Warnings🚀 ShockSentinel Early Warnings — Advanced Multi-Symbol Shock Detection System
📊 UNIQUE METHODOLOGY:
This indicator implements a proprietary concordance-based shock detection system that goes beyond simple price movement analysis. Unlike basic pump/dump detectors, it uses a sophisticated multi-symbol correlation algorithm to validate signals across multiple assets simultaneously, significantly reducing false positives while maintaining sensitivity to genuine market shocks.
🔬 TECHNICAL APPROACH:
• Adaptive Threshold System: Automatically adjusts detection sensitivity based on timeframe using proprietary scaling algorithms:
- 1m: 0.5% threshold (ultra-sensitive for scalping)
- 3m: 1.0% threshold (high-frequency trading)
- 5m: 2.0% threshold (short-term momentum)
- 15m: 3.0% threshold (intraday swings)
- 1h: 6.0% threshold (daily moves)
- 4h+: 10.0% threshold (swing trading)
• Dual Detection Modes:
- Percent Mode: Calculates maximum percentage change within configurable lookback window (1-6 bars) using the formula: max(|(close - close ) / close * 100|) for i = 1 to window
- ATR-Normalized Mode: Uses Average True Range for volatility-adjusted detection across different market regimes: max(|close - close | / ATR) for i = 1 to window
• Concordance Algorithm: Proprietary multi-symbol validation system that requires minimum correlation count across up to 4 additional symbols, ensuring signals are validated by market-wide participation rather than isolated price movements
• Non-Repainting Architecture: Optional bar-close confirmation prevents false signals from intraday noise while maintaining real-time alert capability for immediate response
🎯 MATHEMATICAL FOUNDATION:
The core algorithm implements a sliding window maximum change detection:
Percent Change Calculation:
For each bar, the system calculates the maximum absolute percentage change over the specified window:
- PctChange = (close - close ) / close * 100
- MaxPct = max(|PctChange |) for i = 1 to window
- Signal triggers when MaxPct >= threshold
ATR-Normalized Calculation:
For volatility-adjusted detection:
- ATRChange = (close - close ) / ATR
- MaxATR = max(|ATRChange |) for i = 1 to window
- Signal triggers when MaxATR >= ATR_multiplier
Concordance Validation:
- Requires minimum N symbols showing same directional movement
- Validates signal strength through market participation
- Reduces false signals from isolated price movements
- Improves signal quality through correlation analysis
⚙️ ADVANCED FEATURES:
• Preset System: 7 pre-configured strategies with optimized parameters:
- Scalp (Ultra-Fast): 0.6x scaling, 2-bar window, real-time alerts
- Aggressive: 0.7x scaling, 2-bar window, real-time alerts
- Balanced: 1.0x scaling, 3-bar window, confirmed signals
- Conservative: 1.3x scaling, 4-bar window, confirmed signals
- Volatility-Adaptive: ATR mode, 7-period ATR, 2.5x multiplier
- Momentum (Intraday): ATR mode, 10-period ATR, 2.0x multiplier
- Swing (Slow): ATR mode, 14-period ATR, 2.8x multiplier
• Real-time vs Confirmed: Choose between immediate alerts or bar-close confirmation
• Visual Analytics: Integrated signal history table with concordance gauges and performance metrics
• Professional Alerts: Multi-format alert system (Compact, Extended, Plain, CSV) with Telegram integration and customizable messaging
💡 UNIQUE VALUE PROPOSITION:
Unlike simple price change detectors, this system provides:
1. Multi-Symbol Validation: Validates signals across multiple correlated assets, ensuring market-wide participation
2. Adaptive Thresholds: Automatically adjusts sensitivity based on timeframe and market conditions
3. Dual Signal Types: Provides both real-time and confirmed signal options for different trading styles
4. Comprehensive Analytics: Includes signal history, concordance gauges, and performance tracking
5. Advanced Concordance: Uses sophisticated correlation algorithms for signal validation
6. Professional Integration: Built-in Telegram support with customizable message formats
🔧 USAGE INSTRUCTIONS:
1. Select Preset: Choose appropriate strategy for your trading style and timeframe
2. Configure Symbols: Add up to 4 additional symbols for concordance validation
3. Set Concordance: Adjust minimum count (higher = more selective, lower = more sensitive)
4. Choose Mode: Select between real-time or confirmed signals based on your risk tolerance
5. Enable Alerts: Configure notification preferences and message formats
6. Monitor Performance: Use integrated tables to track signal quality and concordance
📈 PERFORMANCE CHARACTERISTICS:
• Optimized for Crypto: Designed specifically for high-volatility cryptocurrency markets
• Multi-Timeframe: Effective across all timeframes from 1-minute to 4-hour charts
• False Signal Reduction: Multi-symbol validation significantly reduces false positives
• Flexible Sensitivity: Adjustable thresholds allow customization for different market conditions
• Real-time Capability: Provides immediate alerts for fast-moving markets
• Confirmation Option: Bar-close confirmation for conservative trading approaches
⚠️ TECHNICAL CONSIDERATIONS:
• Real-time Mode: May generate multiple alerts per bar; use cooldown settings to manage frequency
• Data Dependencies: Concordance requires data availability for all configured symbols
• Market Regimes: ATR mode provides better performance in varying volatility conditions
• Signal Quality: Higher concordance requirements reduce false signals but may miss opportunities
• Latency: request.security calls depend on data provider latency and availability
🎯 TARGET MARKETS:
• Cryptocurrency Trading: High-volatility crypto markets with frequent shock events
• Scalping: Short-term trading strategies requiring immediate signal detection
• Swing Trading: Medium-term strategies benefiting from confirmed signals
• Portfolio Management: Multi-asset correlation analysis for risk management
• Algorithmic Trading: Systematic strategies requiring reliable signal validation
📊 SIGNAL INTERPRETATION:
• Green Arrows (Pump): Upward price shock with sufficient concordance
• Red Arrows (Dump): Downward price shock with sufficient concordance
• Large Markers: Confirmed signals with high concordance
• Small Markers: Early signals with lower concordance
• Background Colors: Visual intensity based on concordance strength
• Tables: Historical signal tracking with performance metrics

HeatCandleHeatCandle - AOC Indicator
✨ Features
📊 Heat-Map Candles: Colors candles based on the price’s deviation from a Triangular Moving Average (TMA), creating a heat-map effect to visualize price zones.
📏 Zone-Based Coloring: Assigns colors to 20 distinct zones (Z0 to Z19) based on the percentage distance from the TMA, with customizable thresholds.
⚙️ Timeframe-Specific Zones: Tailored zone thresholds for 1-minute, 5-minute, 15-minute, 30-minute, 1-hour, and 4-hour timeframes for precise analysis.
🎨 Customizable Visuals: Gradient color scheme from deep blue (oversold) to red (overbought) for intuitive price movement interpretation.
🛠️ Adjustable Parameters: Configure TMA length and threshold multiplier to fine-tune sensitivity.
🛠️ How to Use
Add to Chart: Apply the "HeatCandle - AOC" indicator on TradingView.
Configure Inputs:
TMA Length: Set the period for the Triangular Moving Average (default: 150).
Threshold Multiplier: Adjust the multiplier to scale zone sensitivity (default: 1.0).
Analyze: Observe colored candles on the chart, where colors indicate the price’s deviation from the TMA:
Dark blue (Z0) indicates strong oversold conditions.
Red (Z19) signals strong overbought conditions.
Track Trends: Use the color zones to identify potential reversals, breakouts, or trend strength based on price distance from the TMA.
🎯 Why Use It?
Visual Clarity: The heat-map candle coloring simplifies identifying overbought/oversold conditions at a glance.
Timeframe Flexibility: Zone thresholds adapt to the selected timeframe, ensuring relevance across short and long-term trading.
Customizable Sensitivity: Adjust TMA length and multiplier to match your trading style or market conditions.
Versatile Analysis: Ideal for scalping, swing trading, or trend analysis when combined with other indicators.
📝 Notes
Ensure sufficient historical data for accurate TMA calculations, especially with longer lengths.
The indicator is most effective on volatile markets where price deviations are significant.
Pair with momentum indicators (e.g., RSI, MACD) or support/resistance levels for enhanced trading strategies.
Happy trading! 🚀📈

Multiple Colored Moving AveragesMULTIPLE COLORED MOVING AVERAGES - USER GUIDE
DISCLAIMER
----------
Both the code and this documentation were created heavily using artificial intelligence. I'm lazy...
This indicator was inspired by repo32's "Moving Average Colored EMA/SMA" indicator. *
What is this indicator?
-----------------------
This is a TradingView indicator that displays up to 4 different moving averages on your chart simultaneously. Each moving average can be customized with different calculation methods, colors, and filtering options.
Why would I use multiple moving averages?
-----------------------------------------
- See trend direction across different timeframes at once
- Identify support and resistance levels
- Spot crossover signals between fast and slow MAs
- Reduce false signals with filtering options
- Compare how different MA types react to price action
What moving average types are available?
----------------------------------------
11 different types:
- SMA: Simple average, equal weight to all periods
- EMA: Exponential, more weight to recent prices
- WMA: Weighted, linear weighting toward recent data
- RMA: Running average, smooth like EMA
- DEMA: Double exponential, reduced lag
- TEMA: Triple exponential, even less lag
- HMA: Hull, fast and smooth combination
- VWMA: Volume weighted, includes volume data
- LSMA: Least squares, based on linear regression
- TMA: Triangular, double-smoothed
- ZLEMA: Zero lag exponential, compensated for lag
How do I set up the indicator?
------------------------------
Each MA has these settings:
- Enable/Disable: Turn each MA on or off
- Type: Choose from the 11 calculation methods
- Length: Number of periods (21, 50, 100, 200 are common)
- Smoothing: 0-10 levels of extra smoothing
- Noise Filter: 0-5% to ignore small changes
- Colors: Bullish (rising) and bearish (falling) colors
- Line Width: 1-5 pixels thickness
What does the smoothing feature do?
-----------------------------------
Smoothing applies extra calculations to make the moving average line smoother. Higher levels reduce noise but make the MA respond slower to price changes. Use higher smoothing in choppy markets, lower smoothing in trending markets.
What is the noise filter?
--------------------------
The noise filter ignores small percentage changes in the moving average. For example, a 0.3% filter will ignore any MA movement smaller than 0.3%. This helps eliminate false signals from minor price fluctuations.
When should I use this indicator?
---------------------------------
- Trend analysis: See if market is going up, down, or sideways
- Entry timing: Look for price bounces off MA levels
- Exit signals: Watch for MA slope changes or crossovers
- Support/resistance: MAs often act as dynamic levels
- Multi-timeframe analysis: Use different lengths for different perspectives
What are some good settings to start with?
-------------------------------------------
Conservative approach:
- MA 1: EMA 21 (short-term trend)
- MA 2: SMA 50 (medium-term trend)
- MA 3: SMA 200 (long-term trend)
- Low noise filtering (0.1-0.3%)
Active trading:
- MA 1: HMA 9 (very responsive)
- MA 2: EMA 21 (short-term)
- MA 3: EMA 50 (medium-term)
- Minimal or no smoothing
How do I interpret the colors?
------------------------------
Each MA changes color based on its direction:
- Bullish color: MA is rising (upward trend)
- Bearish color: MA is falling (downward trend)
- Gray: MA is flat or unchanged
What should I look for in crossovers?
-------------------------------------
- Golden Cross: Fast MA crosses above slow MA (bullish signal)
- Death Cross: Fast MA crosses below slow MA (bearish signal)
- Multiple crossovers in same direction can confirm trend changes
- Wait for clear separation between MAs after crossover
How do I use MAs for support and resistance?
---------------------------------------------
- In uptrends: MAs often provide support when price pulls back
- In downtrends: MAs may act as resistance on rallies
- Multiple MAs create support/resistance zones
- Stronger levels where multiple MAs cluster together
Can I use this with other indicators?
-------------------------------------
Yes, it works well with:
- Volume indicators for confirmation
- RSI or MACD for timing entries
- Bollinger Bands for volatility context
- Price action patterns for setup confirmation
What if I get too many signals?
-------------------------------
- Increase smoothing levels
- Raise noise filter percentages
- Use longer MA periods
- Focus on major crossovers only
- Wait for multiple MA confirmation
What if signals are too slow?
-----------------------------
- Reduce smoothing to 0
- Lower noise filter values
- Switch to faster MA types (HMA, ZLEMA, DEMA)
- Use shorter periods
- Focus on the fastest MA only
Which MA types work best in different markets?
----------------------------------------------
Trending markets: EMA, DEMA, TEMA (responsive to trends)
Choppy markets: SMA, TMA, HMA with smoothing (less whipsaws)
High volatility: Use higher smoothing and noise filtering
Low volatility: Use minimal filtering for better responsiveness
Do I need all the advanced features?
------------------------------------
No. Start with basic settings:
- Choose MA type and length
- Set colors you prefer
- Leave smoothing at 0
- Leave noise filter at 0
Add complexity only if needed to improve signal quality.
How do I know if my settings are working?
-----------------------------------------
- Backtest on historical data
- Paper trade the signals first
- Adjust based on market conditions
- Keep a trading journal to track performance
- Be willing to modify settings as markets change
Can I save different configurations?
------------------------------------
Yes, save different indicator templates in TradingView for:
- Different trading styles (scalping, swing trading)
- Different market conditions (trending, ranging)
- Different instruments (stocks, forex, crypto)

ProfitAlgo.io TrendSync SimulationThe TrendSync Simulation is a gradient-based trend-following framework that helps traders quickly identify bullish vs bearish market structure while filtering out short-term noise.
Instead of relying on a single moving average or indicator, TrendSync builds a layered “trend cloud” in 3 different MODES, KUMO, PFA, HMA anchored against a reference band. These layers create a visual gradient that shifts with market direction.
When combined with its color-adaptive candles, you can turn off your candle setting colors within the chart settings of TradingView for the TrendSync color mapping which transforms raw price action into an easy-to-read flow map of institutional momentum.
📊 How It Works
Each layer creates a smooth gradient that shifts with trend direction:
Bullish trends form a rising, green-shaded cloud.
Bearish trends form a descending, red-shaded cloud.
Transitions appear as fading or compressing gradients, signaling potential reversals or consolidations.
Candles are also dynamically colored based on normalized momentum, allowing traders to see directional strength at a glance.
🔑 Key Features
✅ Gradient Cloud – A layered trend structure that visually shifts from bearish → bullish.
✅ Multiple Modes – Choose between KUMO, PFA, or HMA logic for responsiveness vs. smoothness.
✅ Dynamic Trend Candles – Bars adapt color based on momentum strength.
✅ Customizable Visualization – Adjust transparency, colors, and gradient strength to fit your chart style.
✅ Clarity of Direction – Highlights dominant flow while reducing noise from minor fluctuations.
⚙️ Settings Explained
Trend Method (KUMO / PFA / HMA): Controls the type of moving average used for the cloud.
Gradient Colors: Define the shading of bullish vs. bearish zones.
Transparency Controls: Adjust how strong or subtle the gradient cloud appears.
Lookback Length : Longer = smoother trend; shorter = more reactive.
💡 Use Cases
Identify trend bias quickly without switching between multiple indicators.
Confirm entries with liquidity or breakout strategies by aligning with the cloud.
Detect weakening or strengthening momentum via gradient compression.
Avoid trading against dominant higher time-frame flow with trend-colored candles .
⚡ Why It Matters
Markets often look chaotic on raw candlestick charts. TrendSync cuts through that noise by layering moving averages into a visual gradient, revealing institutional momentum in real time. Whether scalping, day trading, or swing trading, TrendSync provides a synchronized view of trend direction that adapts to different trading styles.
⚡ Paired with the Back End Order Matrix, TrendSync provides the clarity of direction after liquidity zones are exposed, creating a complete institutional-style framework inside TradingView.
EXAMPLE 1A
EXAMPLE 1B
EXAMPLE 1C
EXAMPLE 2A
Multiplied and Divided Moving Average ### Multiplied and Divided Moving Average Indicator
**Description**:
The "Multiplied and Divided Moving Average" indicator is a customizable tool for TradingView users, designed to create dynamic bands around a user-selected moving average (MA). It calculates a moving average (SMA, EMA, WMA, VWMA, or RMA) and generates a user-defined number of lines above and below it by multiplying and dividing the MA by linearly spaced factors. These bands serve as potential support and resistance levels, aiding in trend identification, mean reversion strategies, or breakout detection. Optional Buy/Sell labels appear when the price crosses below the divided MAs (Buy) or above the multiplied MAs (Sell), providing clear visual cues for trading opportunities.
**Key Features**:
- **Flexible MA Types**: Choose from Simple (SMA), Exponential (EMA), Weighted (WMA), Volume-Weighted (VWMA), or Running (RMA) moving averages.
- **Customizable Bands**: Set the number of lines (0–10) above and below the MA, allowing tailored analysis for any market or timeframe.
- **Dynamic Factors**: Bands are created using factors that scale linearly from 1 to a user-defined maximum (default: 5.0), creating intuitive overbought/oversold zones.
- **Buy/Sell Signals**: Optional labels highlight potential entry (Buy) and exit (Sell) points when the price crosses the bands.
- **Clear Visuals**: The main MA is plotted in blue, with green (multiplied) and red (divided) lines using graduated transparency for easy differentiation.
**Inputs**:
- **MA Type**: Select the moving average type (default: SMA).
- **MA Length**: Set the MA period (default: 14).
- **Number of Lines Above/Below**: Choose how many bands to plot above and below the MA (default: 4, range: 0–10).
- **Max Factor**: Define the largest multiplier/divisor for the outermost bands (default: 5.0).
- **Source**: Select the price data for the MA (default: close).
- **Show Buy/Sell Labels**: Enable or disable Buy/Sell labels (default: true).
**How It Works**:
1. Calculates the chosen moving average based on user inputs.
2. Creates up to 10 lines above the MA (e.g., MA × 2, ×3, ×4, ×5 for `numLines=4`, `maxFactor=5`) and 10 below (e.g., MA ÷ 2, ÷3, ÷4, ÷5).
3. Plots the main MA in blue, multiplied lines in green, and divided lines in red, with transparency increasing for outer bands.
4. If enabled, displays "Buy" labels when the price crosses below any divided MA and "Sell" labels when it crosses above any multiplied MA, positioned at the outermost band.
**Use Cases**:
- **Trend Analysis**: Use the bands as dynamic support/resistance to confirm trend direction or reversals.
- **Mean Reversion**: Identify overbought (near multiplied MAs) or oversold (near divided MAs) conditions.
- **Breakout Trading**: Monitor price crossovers of the outermost bands for potential breakout signals.
- **Signal Confirmation**: Use Buy/Sell labels for swing trading or to complement other indicators.
**How to Use**:
1. Copy the script into TradingView’s Pine Editor.
2. Compile and apply it to your chart (e.g., stocks, forex, crypto).
3. Adjust inputs like `numLines`, `maxFactor`, or `maType` to fit your strategy.
4. Enable `Show Buy/Sell Labels` to visualize trading signals.
5. Test on various timeframes (e.g., 1H, 4H, 1D) and assets to optimize settings.
**Example Settings**:
- **Swing Trading**: Use `numLines=3`, `maxFactor=4`, `maType=EMA`, `maLength=20` on a 4-hour chart.
- **Intraday**: Try `numLines=2`, `maxFactor=3`, `maType=SMA`, `maLength=10` on a 15-minute chart.
**Notes**:
- **Performance**: Supports up to 20 bands (10 above, 10 below), staying within TradingView’s 64-plot limit.
- **False Signals**: In choppy markets, frequent crossovers may occur. Combine with trend filters (e.g., ADX, higher-timeframe MA) to reduce noise.
- **Enhancements**: Add alerts via TradingView’s alert system for Buy/Sell signals, or experiment with different `maxFactor` values for volatility.
**Limitations**:
- Bands are reactive, as they’re based on a moving average, so confirm signals with other indicators.
- High `numLines` values may clutter the chart; use 2–4 for clarity.
- Signals may lag in fast-moving markets due to the MA’s smoothing effect.
This indicator is perfect for traders seeking a customizable, visually clear tool to enhance technical analysis on TradingView. For support, feature requests (e.g., alerts, custom colors), or community discussion, visit TradingView’s forums or contact the script author.

APC Companion – Volume Accumulation/DistributionIndicator Description (TradingView – Open Source)
APC Companion – Volume Accumulation/Distribution Filter
(Designed to work standalone or together with the APC Compass)
What this indicator does
The APC Companion measures whether markets are under Accumulation (buying pressure) or Distribution (selling pressure) by combining:
Chaikin A/D slope – volume flow into price moves
On-Balance Volume momentum – confirms trend strength
VWAP spread – price vs. fair value by traded volume
CLV × Volume Z-Score – detects intrabar absorption / selling pressure
VWMA vs. EMA100 – confirms whether weighted volume supports price action
The result is a single Acc/Dist Score (−5 … +5) and a Coherence % showing how many signals agree.
How to interpret
Score ≥ +3 & Coherence ≥ 60% → Accumulation (green) → market supported by buyers
Score ≤ −3 & Coherence ≥ 60% → Distribution (red) → market pressured by sellers
Anything in between = neutral (no strong bias)
Using with APC Compass
Long trades: Only take Compass Long signals when Companion shows Accumulation.
Short trades: Only take Compass Short signals when Companion shows Distribution.
Neutral Companion: Skip or reduce size if there is no confirmation.
This filter greatly reduces false signals and improves trade quality.
Best practice
Swing trading: 4H / 1D charts, lenZ 40–80, lenSlope 14–20
Intraday: 5m–30m charts, lenZ 20–30, lenSlope 10–14
Position sizing: Increase with higher Coherence %, reduce when below 60%
Exits: Reduce or close if Score drops back to neutral or flips opposite
Disclaimer
This script is published open source for educational purposes only.
It is not financial advice. Test thoroughly before using in live trading.
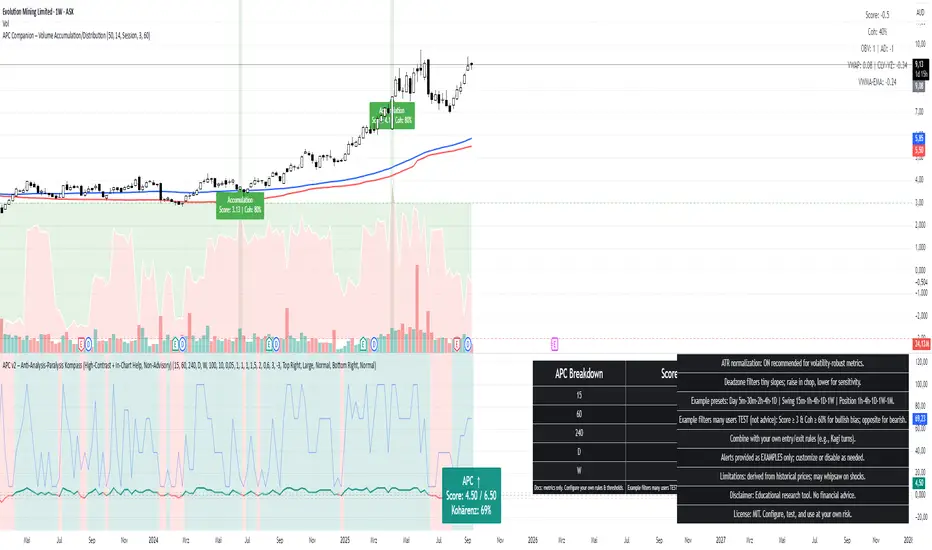
5 Adaptable SMA bandsProfessional-grade technical indicator designed for elite traders who demand precision, visual clarity, and adaptive market analysis.
This sophisticated tool revolutionizes traditional Simple Moving Average analysis by transforming thin lines into dynamic, adaptive bands that provide superior trend identification and market structure visualization across all timeframes and asset classes.
🎯 Key Professional Features
5 Fully Configurable SMAs with independent period, color, and width controls
3 Advanced Adaptation Methods: Price Percentage, ATR Adaptive, Dynamic Volatility
Institutional-Grade Visual Design with thick, clearly visible bands
Real-Time Information Dashboard displaying all active parameters
Professional Default Setup: SMA 8 (Green), SMA 20 (Blue), SMA 200 (Red)
Precision Band Width Control from 0.05% to 2.0% with 0.05% increments
Individual Toggle Control for each moving average
Optional Center Lines for exact price level identification
📈 Advanced Adaptation Technology
Price Percentage Method: Band width as percentage of SMA value
ATR Adaptive Method (Recommended): Automatically adjusts to market volatility using Average True Range
Dynamic Volatility Method: Uses standard deviation for high-volatility instruments
💼 Professional Trading Applications
Multi-Timeframe Trend Analysis: Identify short, medium, and long-term trends simultaneously
Dynamic Support/Resistance Levels: Adaptive bands act as dynamic S/R zones
Market Structure Analysis: Visualize trend strength and momentum shifts
Entry/Exit Signal Enhancement: Clear visual confirmation of trend changes
Risk Management: Better position sizing based on volatility-adjusted bands
🏆 Competitive Advantages
Superior Visual Clarity: Thick bands are easier to identify than traditional thin lines
Automatic Volatility Adjustment: Adapts to any instrument's characteristics
Zoom-Independent Scaling: Maintains visual proportions at any chart zoom level
Universal Compatibility: Works flawlessly on Forex, Stocks, Crypto, Commodities, Indices
⚙️ Recommended Professional Setups
Scalping: SMAs 8, 20, 50 with ATR Adaptive method
Day Trading: SMAs 20, 50, 100 with 0.3-0.5% band width
Swing Trading: SMAs 50, 100, 200 with Dynamic Volatility method
Position Trading: SMAs 100, 200 with 0.5-0.8% band width

[blackcat] L2 Trend LinearityOVERVIEW
The L2 Trend Linearity indicator is a sophisticated market analysis tool designed to help traders identify and visualize market trend linearity by analyzing price action relative to dynamic support and resistance zones. This powerful Pine Script indicator utilizes the Arnaud Legoux Moving Average (ALMA) algorithm to calculate weighted price calculations and generate dynamic support/resistance zones that adapt to changing market conditions. By visualizing market zones through colored candles and histograms, the indicator provides clear visual cues about market momentum and potential trading opportunities. The script generates buy/sell signals based on zone crossovers, making it an invaluable tool for both technical analysis and automated trading strategies. Whether you're a day trader, swing trader, or algorithmic trader, this indicator can help you identify market regimes, support/resistance levels, and potential entry/exit points with greater precision.
FEATURES
Dynamic Support/Resistance Zones: Calculates dynamic support (bear market zone) and resistance (bull market zone) using weighted price calculations and ALMA smoothing
Visual Market Representation: Color-coded candles and histograms provide immediate visual feedback about market conditions
Smart Signal Generation: Automatic buy/sell signals generated from zone crossovers with clear visual indicators
Customizable Parameters: Four different ALMA smoothing parameters for various timeframes and trading styles
Multi-Timeframe Compatibility: Works across different timeframes from 1-minute to weekly charts
Real-time Analysis: Provides instant feedback on market momentum and trend direction
Clear Visual Cues: Green candles indicate bullish momentum, red candles indicate bearish momentum, and white candles indicate neutral conditions
Histogram Visualization: Blue histogram shows bear market zone (below support), aqua histogram shows bull market zone (above resistance)
Signal Labels: "B" labels mark buy signals (price crosses above resistance), "S" labels mark sell signals (price crosses below support)
Overlay Functionality: Works as an overlay indicator without cluttering the chart with unnecessary elements
Highly Customizable: All parameters can be adjusted to suit different trading strategies and market conditions
HOW TO USE
Add the Indicator to Your Chart
Open TradingView and navigate to your desired trading instrument
Click on "Indicators" in the top menu and select "New"
Search for "L2 Trend Linearity" or paste the Pine Script code
Click "Add to Chart" to apply the indicator
Configure the Parameters
ALMA Length Short: Set the short-term smoothing parameter (default: 3). Lower values provide more responsive signals but may generate more false signals
ALMA Length Medium: Set the medium-term smoothing parameter (default: 5). This provides a balance between responsiveness and stability
ALMA Length Long: Set the long-term smoothing parameter (default: 13). Higher values provide more stable signals but with less responsiveness
ALMA Length Very Long: Set the very long-term smoothing parameter (default: 21). This provides the most stable support/resistance levels
Understand the Visual Elements
Green Candles: Indicate bullish momentum when price is above the bear market zone (support)
Red Candles: Indicate bearish momentum when price is below the bull market zone (resistance)
White Candles: Indicate neutral market conditions when price is between support and resistance zones
Blue Histogram: Shows bear market zone when price is below support level
Aqua Histogram: Shows bull market zone when price is above resistance level
"B" Labels: Mark buy signals when price crosses above resistance
"S" Labels: Mark sell signals when price crosses below support
Identify Market Regimes
Bullish Regime: Price consistently above resistance zone with green candles and aqua histogram
Bearish Regime: Price consistently below support zone with red candles and blue histogram
Neutral Regime: Price oscillating between support and resistance zones with white candles
Generate Trading Signals
Buy Signals: Look for price crossing above the bull market zone (resistance) with confirmation from green candles
Sell Signals: Look for price crossing below the bear market zone (support) with confirmation from red candles
Confirmation: Always wait for confirmation from candle color changes before entering trades
Optimize for Different Timeframes
Scalping: Use shorter ALMA lengths (3-5) for 1-5 minute charts
Day Trading: Use medium ALMA lengths (5-13) for 15-60 minute charts
Swing Trading: Use longer ALMA lengths (13-21) for 1-4 hour charts
Position Trading: Use very long ALMA lengths (21+) for daily and weekly charts
LIMITATIONS
Whipsaw Markets: The indicator may generate false signals in choppy, sideways markets where price oscillates rapidly between support and resistance
Lagging Nature: Like all moving average-based indicators, there is inherent lag in the calculations, which may result in delayed signals
Not a Standalone Tool: This indicator should be used in conjunction with other technical analysis tools and risk management strategies
Market Structure Dependency: Performance may vary depending on market structure and volatility conditions
Parameter Sensitivity: Different markets may require different parameter settings for optimal performance
No Volume Integration: The indicator does not incorporate volume data, which could provide additional confirmation signals
Limited Backtesting: Pine Script limitations may restrict comprehensive backtesting capabilities
Not Suitable for All Instruments: May perform differently on stocks, forex, crypto, and futures markets
Requires Confirmation: Signals should always be confirmed with other indicators or price action analysis
Not Predictive: The indicator identifies current market conditions but does not predict future price movements
NOTES
ALMA Algorithm: The indicator uses the Arnaud Legoux Moving Average (ALMA) algorithm, which is known for its excellent smoothing capabilities and reduced lag compared to traditional moving averages
Weighted Price Calculations: The bear market zone uses (2low + close) / 3, while the bull market zone uses (high + 2close) / 3, providing more weight to recent price action
Dynamic Zones: The support and resistance zones are dynamic and adapt to changing market conditions, making them more responsive than static levels
Color Psychology: The color scheme follows traditional trading psychology - green for bullish, red for bearish, and white for neutral
Signal Timing: The signals are generated on the close of each bar, ensuring they are based on complete price action
Label Positioning: Buy signals appear below the bar (red "B" label), while sell signals appear above the bar (green "S" label)
Multiple Timeframes: The indicator can be applied to multiple timeframes simultaneously for comprehensive analysis
Risk Management: Always use proper risk management techniques when trading based on indicator signals
Market Context: Consider the overall market context and trend direction when interpreting signals
Confirmation: Look for confirmation from other indicators or price action patterns before entering trades
Practice: Test the indicator on historical data before using it in live trading
Customization: Feel free to experiment with different parameter combinations to find what works best for your trading style
THANKS
Special thanks to the TradingView community and the Pine Script developers for creating such a powerful and flexible platform for technical analysis. This indicator builds upon the foundation of the ALMA algorithm and various moving average techniques developed by technical analysis pioneers. The concept of dynamic support and resistance zones has been refined over decades of market analysis, and this script represents a modern implementation of these timeless principles. We acknowledge the contributions of all traders and developers who have contributed to the evolution of technical analysis and continue to push the boundaries of what's possible with algorithmic trading tools.

Laguerre-Kalman Adaptive Filter | AlphaNattLaguerre-Kalman Adaptive Filter |AlphaNatt
A sophisticated trend-following indicator that combines Laguerre polynomial filtering with Kalman optimal estimation to create an ultra-smooth, low-lag trend line with exceptional noise reduction capabilities.
"The perfect trend line adapts to market conditions while filtering out noise - this indicator achieves both through advanced mathematical techniques rarely seen in retail trading."
━━━━━━━━━━━━━━━━━━━━━━━━━━━━━━━━━━━━━━━━
🎯 KEY FEATURES
Dual-Filter Architecture: Combines two powerful filtering methods for superior performance
Adaptive Volatility Adjustment: Automatically adapts to market conditions
Minimal Lag: Laguerre polynomials provide faster response than traditional moving averages
Optimal Noise Reduction: Kalman filtering removes market noise while preserving trend
Clean Visual Design: Color-coded trend visualization (cyan/pink)
━━━━━━━━━━━━━━━━━━━━━━━━━━━━━━━━━━━━━━━━
📊 THE MATHEMATICS
1. Laguerre Filter Component
The Laguerre filter uses a cascade of four all-pass filters with a single gamma parameter:
4th order IIR (Infinite Impulse Response) filter
Single parameter (gamma) controls all filter characteristics
Provides smoother output than EMA with similar lag
Based on Laguerre polynomials from quantum mechanics
2. Kalman Filter Component
Implements a simplified Kalman filter for optimal estimation:
Prediction-correction algorithm from aerospace engineering
Dynamically adjusts based on estimation error
Provides mathematically optimal estimate of true price trend
Reduces noise while maintaining responsiveness
3. Adaptive Mechanism
Monitors market volatility in real-time
Adjusts filter parameters based on current conditions
More responsive in trending markets
More stable in ranging markets
━━━━━━━━━━━━━━━━━━━━━━━━━━━━━━━━━━━━━━━━
⚙️ INDICATOR SETTINGS
Laguerre Gamma (0.1-0.99): Controls filter smoothness. Higher = smoother but more lag
Adaptive Period (5-100): Lookback for volatility calculation
Kalman Noise Reduction (0.1-2.0): Higher = more noise filtering
Trend Threshold (0.0001-0.01): Minimum change to register trend shift
Recommended Settings:
Scalping: Gamma: 0.6, Period: 10, Noise: 0.3
Day Trading: Gamma: 0.8, Period: 20, Noise: 0.5 (default)
Swing Trading: Gamma: 0.9, Period: 30, Noise: 0.8
Position Trading: Gamma: 0.95, Period: 50, Noise: 1.2
━━━━━━━━━━━━━━━━━━━━━━━━━━━━━━━━━━━━━━━━
📈 TRADING SIGNALS
Primary Signals:
Cyan Line: Bullish trend - price above filter and filter ascending
Pink Line: Bearish trend - price below filter or filter descending
Color Change: Potential trend reversal point
Entry Strategies:
Trend Continuation: Enter on pullback to filter line in trending market
Trend Reversal: Enter on color change with volume confirmation
Breakout: Enter when price crosses filter with momentum
Exit Strategies:
Exit long when line turns from cyan to pink
Exit short when line turns from pink to cyan
Use filter as trailing stop in strong trends
━━━━━━━━━━━━━━━━━━━━━━━━━━━━━━━━━━━━━━━━
✨ ADVANTAGES OVER TRADITIONAL INDICATORS
Vs. Moving Averages:
Significantly less lag while maintaining smoothness
Adaptive to market conditions
Better noise filtering
Vs. Standard Filters:
Dual-filter approach provides optimal estimation
Mathematical foundation from signal processing
Self-adjusting parameters
Vs. Other Trend Indicators:
Cleaner signals with fewer whipsaws
Works across all timeframes
No repainting or lookahead bias
━━━━━━━━━━━━━━━━━━━━━━━━━━━━━━━━━━━━━━━━
🎓 MATHEMATICAL BACKGROUND
The Laguerre filter was developed by John Ehlers, applying Laguerre polynomials (used in quantum mechanics) to financial markets. These polynomials provide an elegant solution to the lag-smoothness tradeoff that plagues traditional moving averages.
The Kalman filter, developed by Rudolf Kalman in 1960, is used in everything from GPS systems to spacecraft navigation. It provides the mathematically optimal estimate of a system's state given noisy measurements.
By combining these two approaches, this indicator achieves what neither can alone: a smooth, responsive trend line that adapts to market conditions while filtering out noise.
━━━━━━━━━━━━━━━━━━━━━━━━━━━━━━━━━━━━━━━━
💡 TIPS FOR BEST RESULTS
Confirm with Volume: Strong trends should have increasing volume
Multiple Timeframes: Use higher timeframe for trend, lower for entry
Combine with Momentum: RSI or MACD can confirm filter signals
Market Conditions: Adjust noise parameter based on market volatility
Backtesting: Always test settings on your specific instrument
━━━━━━━━━━━━━━━━━━━━━━━━━━━━━━━━━━━━━━━━
⚠️ IMPORTANT NOTES
No indicator is perfect - always use proper risk management
Best suited for trending markets
May produce false signals in choppy/ranging conditions
Not financial advice - for educational purposes only
━━━━━━━━━━━━━━━━━━━━━━━━━━━━━━━━━━━━━━━━
🚀 CONCLUSION
The Laguerre-Kalman Adaptive Filter represents a significant advancement in technical analysis, bringing institutional-grade mathematical techniques to retail traders. Its unique combination of polynomial filtering and optimal estimation provides a clean, reliable trend-following tool that adapts to changing market conditions.
Whether you're scalping on the 1-minute chart or position trading on the daily, this indicator provides clear, actionable signals with minimal false positives.
"In the world of technical analysis, the edge comes from using better mathematics. This indicator delivers that edge."
━━━━━━━━━━━━━━━━━━━━━━━━━━━━━━━━━━━━━━━━
Developed by AlphaNatt | Professional Quantitative Trading Tools
Version: 1.0
Last Updated: 2025
Pine Script: v6
License: Open Source
Not financial advice. Always DYOR

Opening Candle & Previous Day High and Low LevelsOpening Candle & Previous Day High/Low
This indicator automatically plots important reference levels that many traders use as key decision points:
Opening Candle High/Low
• Draws horizontal rays from the day’s opening candle (default 5-minute, adjustable).
• Choose between regular trading hours (09:30–16:00) or extended hours (pre/post-market).
• Fully customizable colors, styles, and widths.
Previous Day High/Low
• Marks the prior day’s high and low for easy reference.
• Works in both RTH-only or 24-hour session modes.
• Customizable styling for clarity on any chart.
Alerts
• Alerts can be triggered when price touches/crosses a level or comes near it.
• “Near” mode supports absolute points, percent of price, or ATR multiples.
• Users can monitor one specific line (Open High, Open Low, Prev High, Prev Low) or all levels together.
• Option to use intra-bar wick detection (immediate) or close-only confirmation.
Labels
• Optional price labels at the last bar, clearly identifying each active level.
-- How to Use It
TLDR: This indicator helps you track the opening range and the previous days highs/lows with alerts and automatically drawn & customizable lines. This is useful for intraday setups and swing strategies alike.
Day Trading:
• Opening range high/low helps spot early breakouts, breakdowns, and false moves. Good for positioning for Long or Short trades as well as SL areas.
• Prior day’s high/low often act as support/resistance zones where momentum stalls or accelerates.
• Alerts let you focus on scanning while the script tracks levels for you.
Large-Cap Swing Trading:
• Previous day’s high/low highlight areas institutions often defend or break through.
• Opening range levels provide short-term confirmation zones for swing entries.
• Monitoring how price reacts to these levels across multiple days can signal trend continuation or reversal on large-cap names.
Dow Theory Indicator## 🎯 Key Features of the Indicator
### 📈 Complete Implementation of Dow Theory
- Three-tier trend structure: primary trend (50 periods), secondary trend (20 periods), and minor trend (10 periods).
- Swing point analysis: automatically detects critical swing highs and lows.
- Trend confirmation mechanism: strict confirmation logic based on consecutive higher highs/higher lows or lower highs/lower lows.
- Volume confirmation: ensures price moves are supported by trading volume.
### 🕐 Flexible Timeframe Parameters
All key parameters are adjustable, making it especially suitable for U.S. equities:
Trend analysis parameters:
- Primary trend period: 20–200 (default 50; recommended 50–100 for U.S. stocks).
- Secondary trend period: 10–100 (default 20; recommended 15–30 for U.S. stocks).
- Minor trend period: 5–50 (default 10; recommended 5–15 for U.S. stocks).
Dow Theory parameters:
- Swing high/low lookback: 5–50 (default 10).
- Trend confirmation bar count: 1–10 (default 3).
- Volume confirmation period: 10–100 (default 20).
### 🇺🇸 U.S. Market Optimizations
- Session awareness: distinguishes Regular Trading Hours (9:30–16:00 EST) from pre-market and after-hours.
- Pre/post-market weighting: adjustable weighting factor for signals during extended hours.
- Earnings season filter: automatically adjusts sensitivity during earnings periods.
- U.S.-optimized default parameters.
## 🎨 Visualization
1. Trend lines: three differently colored trend lines.
2. Background fill: green (uptrend) / red (downtrend) / gray (neutral).
3. Signal markers: arrows, labels, and warning icons.
4. Swing point markers: small triangles at key turning points.
5. Info panel: real-time display of eight key metrics.
## 🚨 Alert System
- Trend turning to up/down.
- Strong bullish/bearish signals (dual confirmation).
- Volume divergence warning.
- New swing high/low formed.
## 📋 How to Use
1. Open the Pine Editor in TradingView.
2. Copy the contents of dow_theory_indicator.pine.
3. Paste and click “Add to chart.”
4. Adjust parameters based on trading style:
- Long-term investing: increase all period parameters.
- Swing trading: use the default parameters.
- Short-term trading: decrease all period parameters.
## 💡 Parameter Tips for U.S. Stocks
- Large-cap blue chips (AAPL, MSFT): primary 60–80, secondary 25–30.
- Mid-cap growth stocks: primary 40–60, secondary 18–25.
- Small-cap high-volatility stocks: primary 30–50, secondary 15–20.

Extreme Zone Volume ProfileExtreme Zone Volume Profile (EZVP)
Originality & Innovation
The Extreme Zone Volume Profile (EZVP) revolutionizes traditional volume profile analysis by applying statistical zone classification to volume distribution. Unlike standard volume profiles that display raw volume data, EZVP segments the price range into statistically meaningful zones based on percentile thresholds, allowing traders to instantly identify where volume concentration suggests strong support/resistance versus areas of potential breakout.
Technical Methodology
Core Algorithm:
Distributes volume across user-defined bins (20-200) over a lookback period
Calculates volume-weighted price levels for each bin
Applies percentile-based zone classification to the price range (not volume ranking)
Zone B (extreme zones): Outer percentile tails representing potential rejection areas
Zone A (significant zones): Secondary percentile bands indicating strong interest levels
Center Zone: Bulk trading range where most price discovery occurs
Mathematical Foundation:
The script uses price-range percentiles rather than volume percentiles. If the total price range is divided into 100%, Zone B captures the extreme price tails (default 2.5% each end ≈ 2 standard deviations), Zone A captures the next significant bands (default 14% each ≈ 1 standard deviation), leaving the center for normal distribution trading.
Key Calculations:
POC (Point of Control): Price level with maximum volume accumulation
Volume-weighted mean price: Total volume × price / total volume
Median price: Geometric center of the price range
Rightward-projected bars: Volume bars extend forward from current time to avoid historical chart clutter
Trading Applications
Zone Interpretation:
Zone B (Red/Green): Extreme price levels where volume suggests strong rejection potential. Price reaching these zones often indicates overextension and possible reversal points.
Zone A (Orange/Teal): Significant support/resistance areas with substantial volume interest. These levels often act as intermediate targets or consolidation zones.
Center (Gray): Fair value area where most trading occurs. Price tends to return to this range during normal market conditions.
Strategic Usage:
Reversal Trading: Look for rejection signals when price enters Zone B areas
Breakout Confirmation: Volume expansion beyond Zone B boundaries suggests genuine breakouts
Support/Resistance: Zone A boundaries often provide reliable entry/exit levels
Mean Reversion: Price tends to gravitate toward the volume-weighted mean and POC lines
Unique Value Proposition
EZVP addresses three key limitations of traditional volume profiles:
Visual Clarity: Standard profiles can be cluttered and difficult to interpret quickly. EZVP's color-coded zones provide instant visual feedback about price significance.
Statistical Framework: Rather than relying on subjective interpretation of volume nodes, EZVP applies objective percentile-based classification, making support/resistance identification more systematic.
Forward-Looking Display: Rightward-projecting bars keep historical price action clean while maintaining current market structure visibility.
Configuration Guide
Lookback Period (10-1000): Controls the historical depth of volume calculation. Shorter periods for intraday scalping, longer for swing trading.
Number of Bins (20-200): Resolution of volume distribution. Higher values provide more granular analysis but may create noise on lower timeframes.
Zone Percentages:
Zone B: Extreme threshold (default 2.5% = ~2σ statistical significance)
Zone A: Significant threshold (default 14% = ~1σ statistical significance)
Visual Controls: Toggle individual elements (POC, median, mean, zone lines) to customize display complexity for your trading style.
Technical Requirements
Pine Script v6 compatible
Maximum bars back: 5000 (ensures sufficient historical data)
Maximum boxes: 500 (supports high-resolution bin counts)
Maximum lines: 50 (accommodates all zone and reference lines)
This indicator synthesizes volume profile theory with statistical zone analysis, providing a quantitative framework for identifying high-probability support/resistance levels based on volume distribution patterns rather than arbitrary price levels.
